|
INTRO:
I'm going on a little bit of an open source visualisation review stint. Last week when I reviewed Zeppelin I came across metabase. When I looked at the UI and visualisation screenshots I was a little blown away on how gorgeous it looked, usually with open-source anything you're faced with engineer lead designs and to be fair.. engineers aren't generally good at making things look good (gives engineers a hug). WHAT IS METABASE? The one liner from the github account says: "Metabase is the easy, open source way for everyone in your company to ask questions and learn from data." After getting under the hood I have found that it's a great replacement for tool suites like Tableau Server or Microstategy. The whole focus is about enabling a data centric organisation, you can tell the contributors have focused deeply on enabling the average user with the ability to deep dive into data without even being close to a SQL power user (easier than excel!). THE INSTALL: My setup is the usual 14.04 ubuntu VM, I also have hosted postgres, mysql and neo4j. So if you're following these steps and you're using a different OS flavour you will need to alter the commands. They say it's a 5 minute install, so I'm hoping this section is pretty small! Download the package (always check for new versions) wget http://downloads.metabase.com/v0.16.1/metabase.jar
Run it
You can tell from the command that metabase is Java, so you're gonna need to have that installed. I'm currently running "Java(TM) SE Runtime Environment (build 1.8.0_51-b16)". You can see your version of Java by running "java -version" on the command line. Ok let's crank it up: java -jar metabase.jar
I think that's the first time I have started something open source without a failure on the first attempt. You get a terminal full of messages like this one:
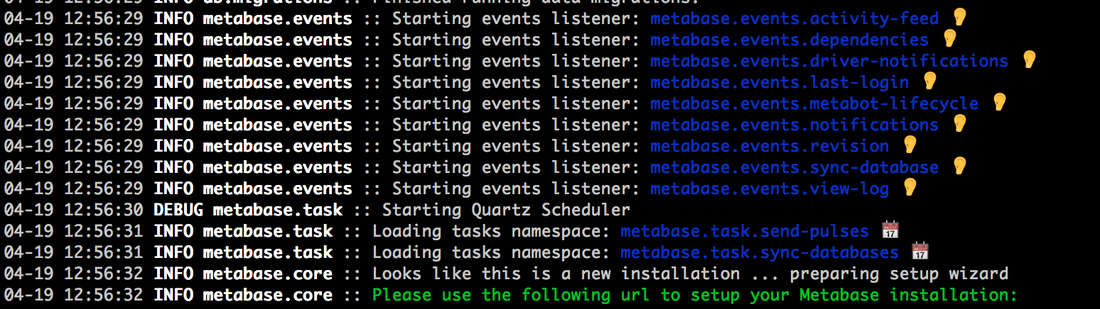
LETS GO EXPLORING! By default metabase starts on port 3000, I navigated to "http://192.168.1.21:3000" (obviously change the IP address to whatever your host is on): 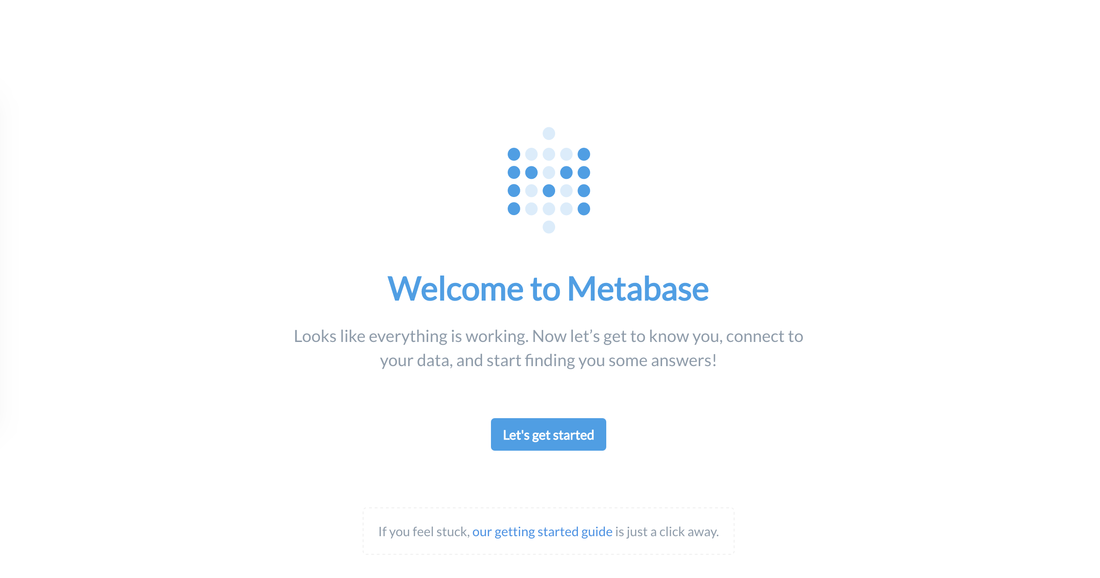
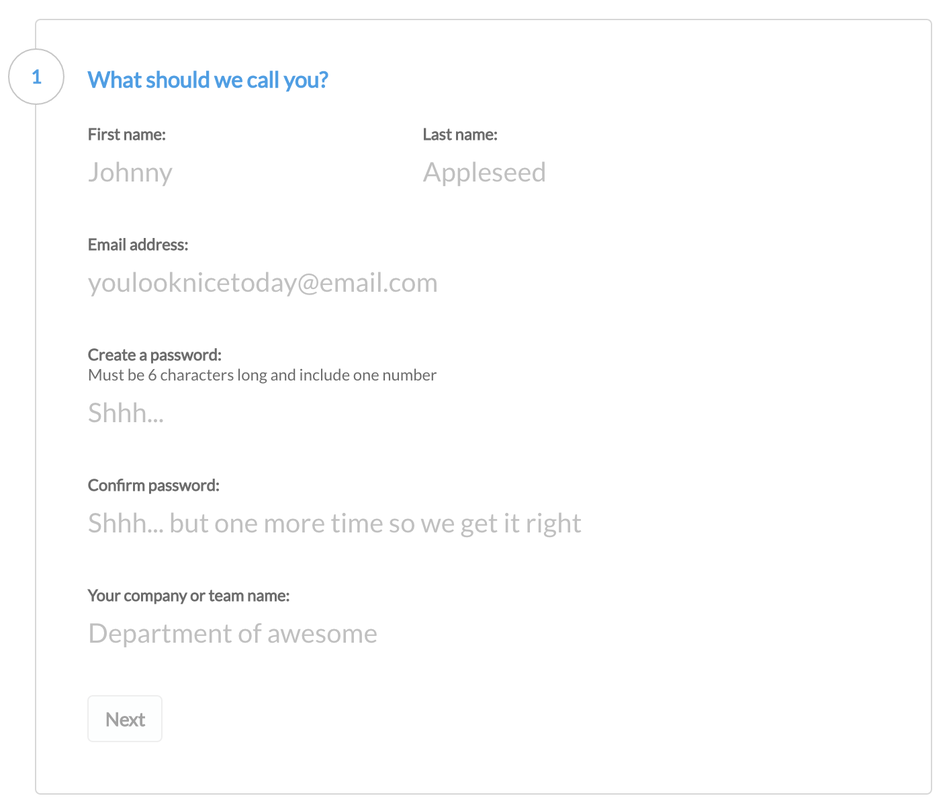
After I select "Let's get started", it's already asking my for account and login creation information. This makes me very hopeful that there is good integrated account management.
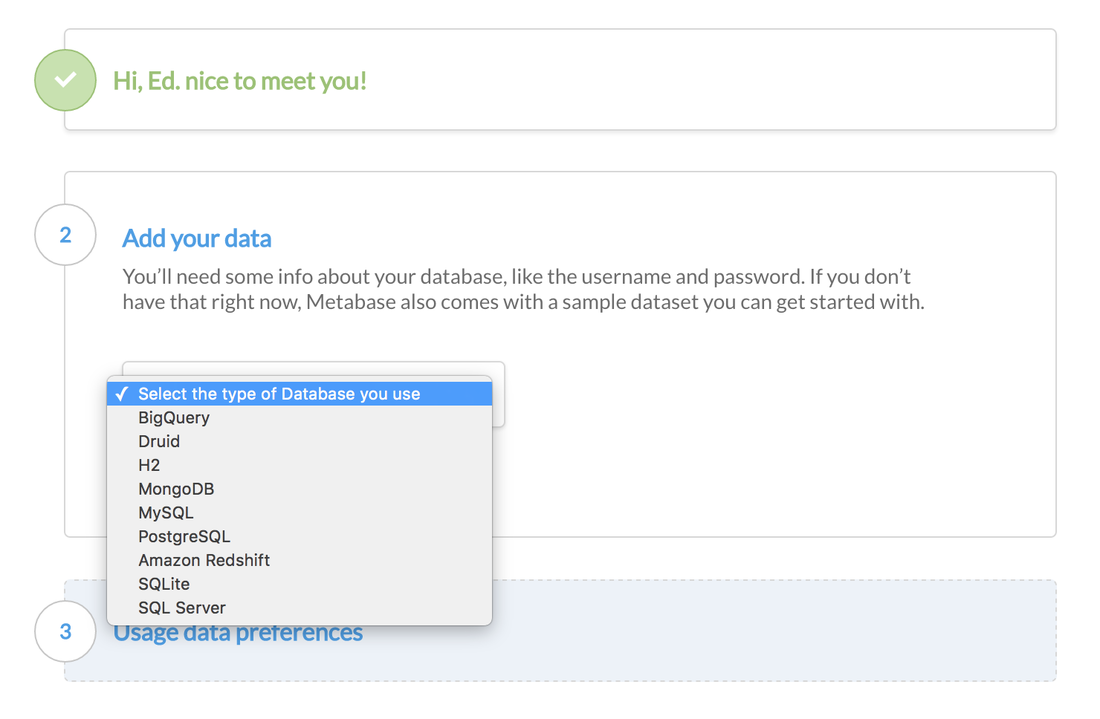
After the login information is complete, it's asking me to setup data sources. You can see it supports a good amount of standard data sources (sql server, postgres etc) and big data tech (redshift, mongo, big query) which is awesome. I'm going to go ahead and connect up my postgres instance.
After I setup my postgres db, it's giving me the option of allowing metabase to collect information on tool usage, you can opt out if you wish.
I'm presented with some nice messages helping me on my MetaBase journey (again.. kudos to whoever is doing the UI/UX)
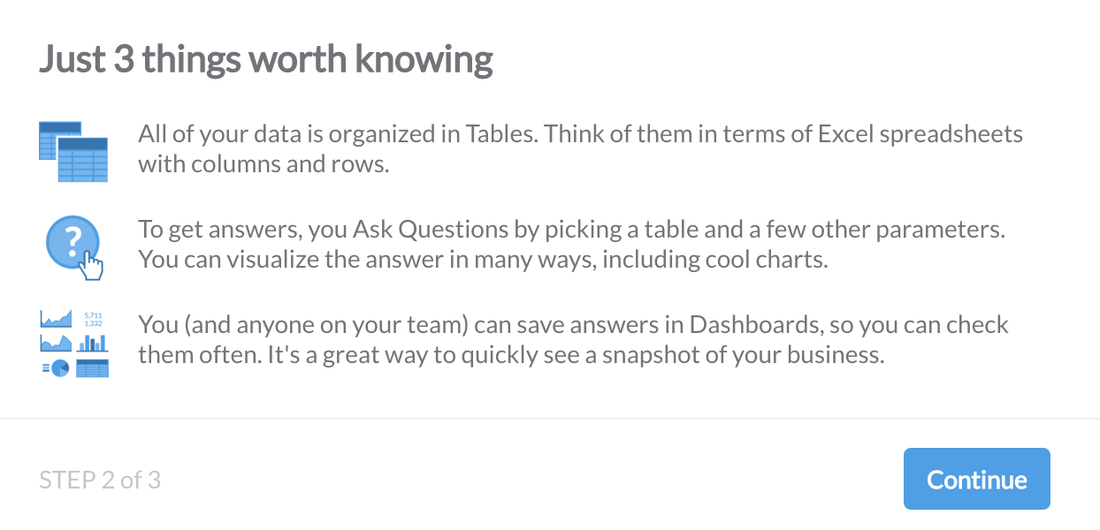
MetaBase has a sample dataset to get started, so if you don't have a DB to connect to you can still evaluate MetaBase. When you first login to Metabase it will take you on your first query tutorial.
MetaBase uses the terminology of "Questions" which I assume they are attempting to take away technical terms like "Query" to open to the door for non technical people to feel comfortable with exploring datasets. I'm going to have a go at running a query against my stock database on postgres. 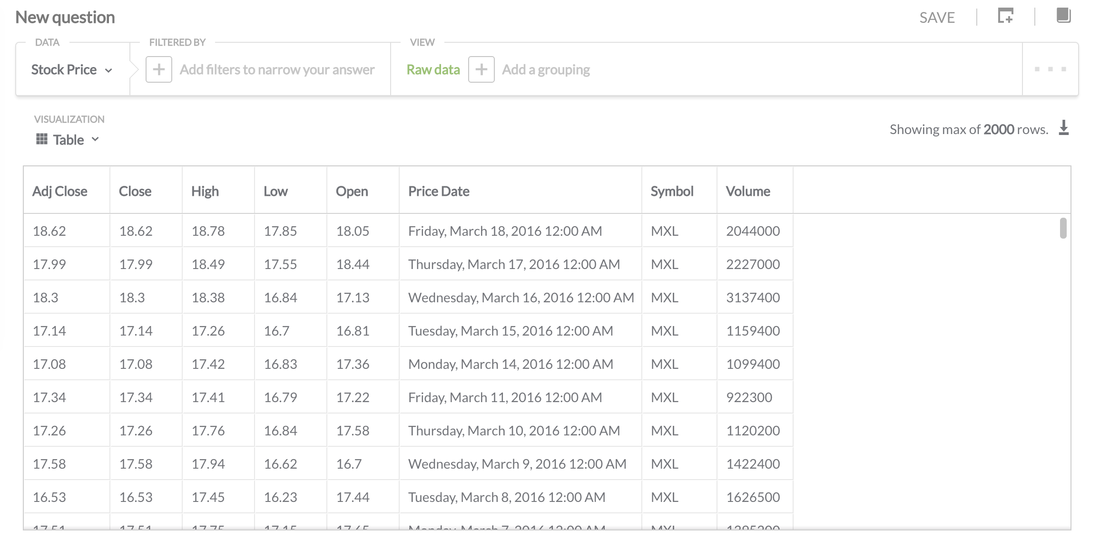
There's nothing fancy going on with this, it's as simple as looking at the raw data. Being a SQL guy for 15 years I have to get my head around the simplified terms to query the data (But I can see that someone without experience would pick it up quick).
If you're an excel power user, you can download the data directly from this page by selecting the download icon towards the upper right of the above screen shot. 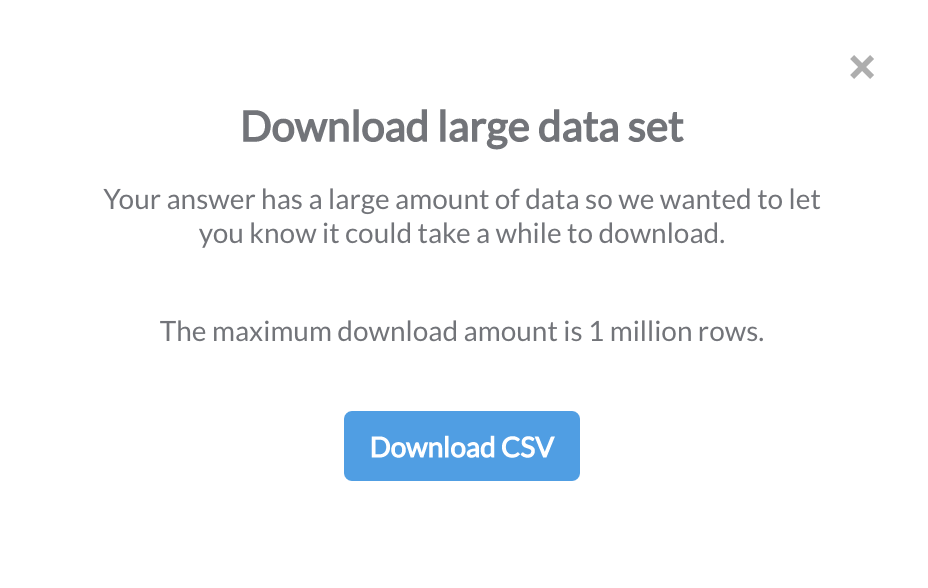
Once I selected the download option, it warns me that the dataset is large and the max I can retrieve is 1 million rows (which will probably crash excel anyway).
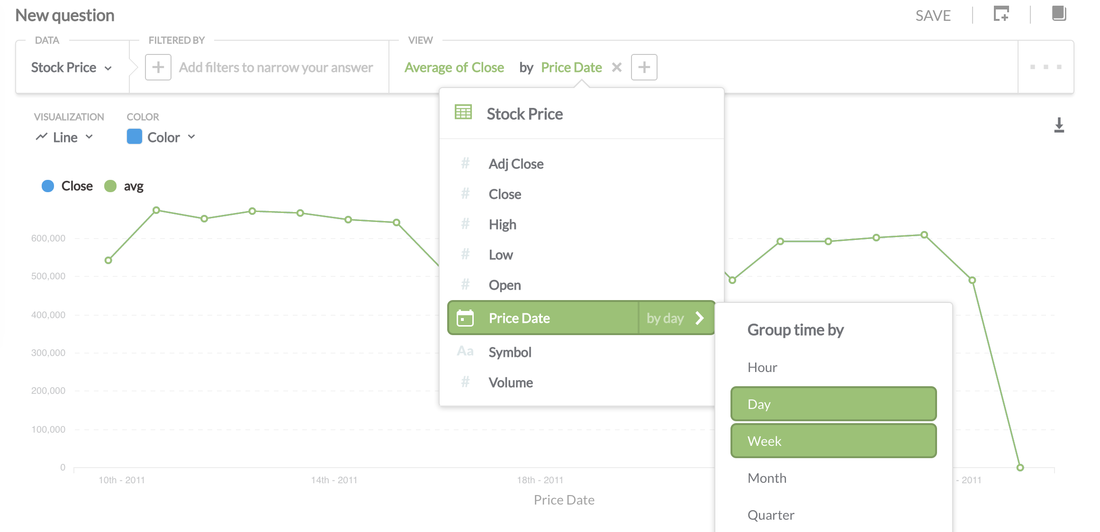
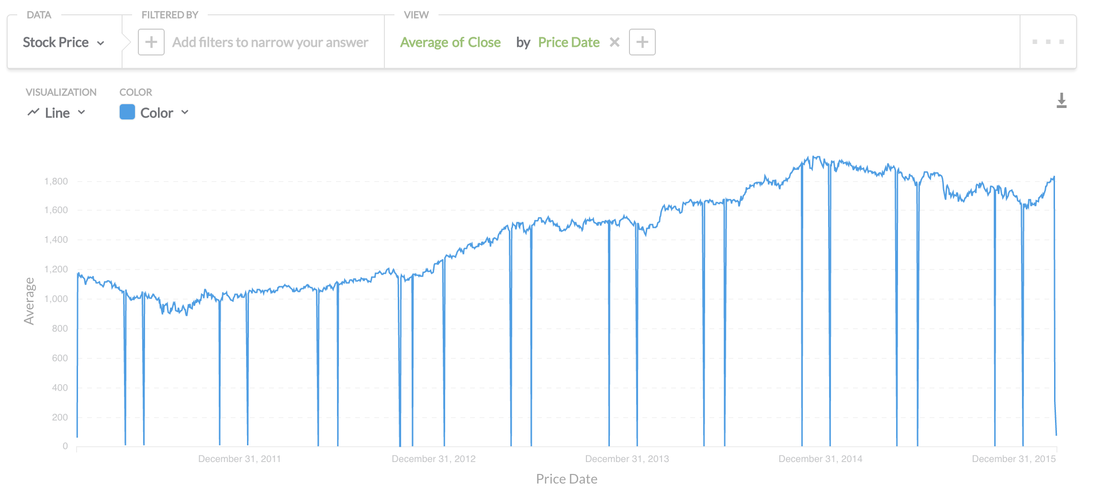
Above I'm doing a simple average aggregation of stock prices. I was super impressed on how easy it was to group by time by providing you with the options of hour, day, week etc, much faster than writing it in SQL.
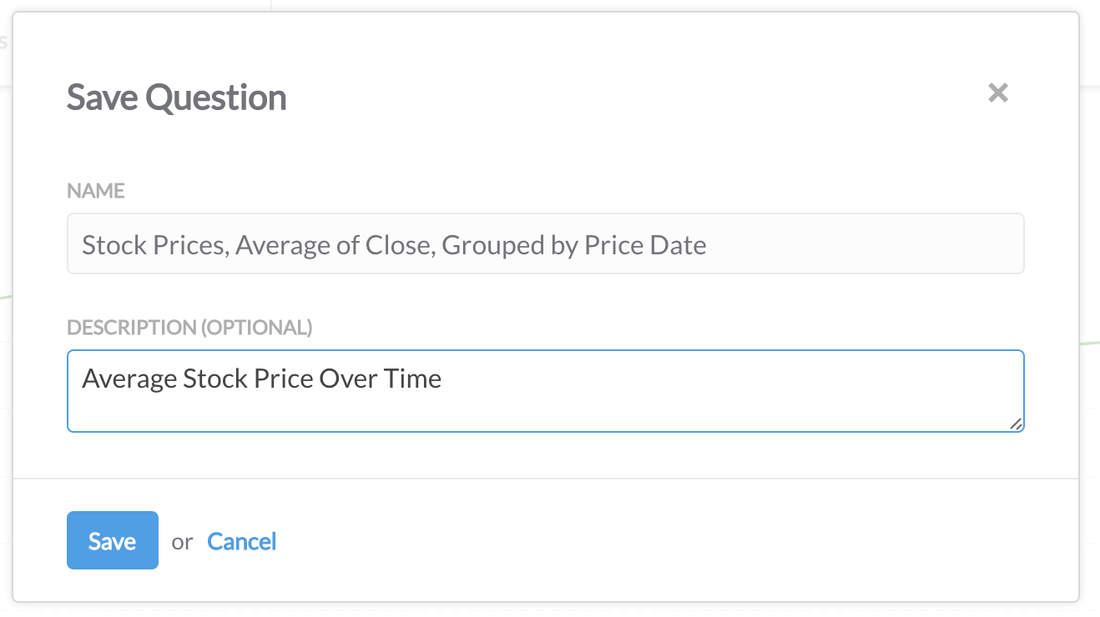
You can save each "Question" providing a useful Description.
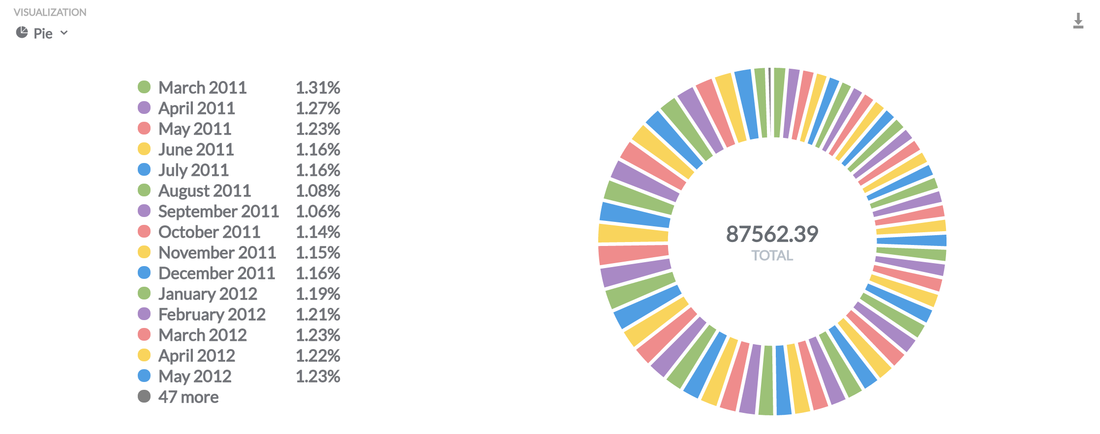
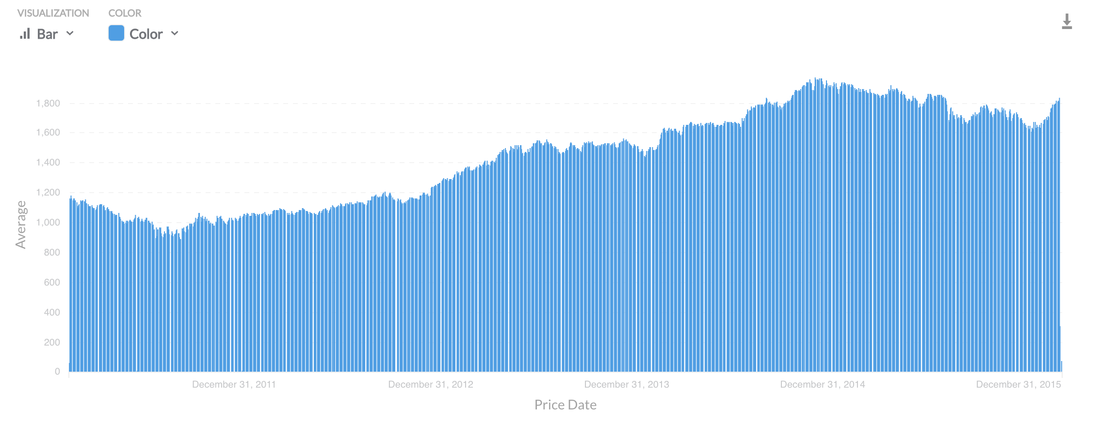
What Visualisations Are Available?: Pie, Line, Bar, Data Charts, Bar, Area and World US Maps 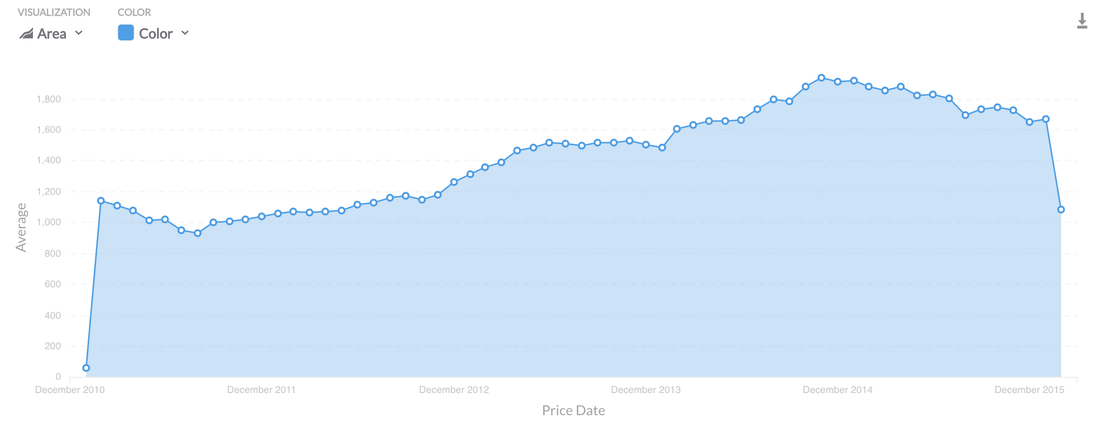
Dashboards
I saved my visualisation above and created a dashboard. To add a visualisation to a dashboard simply hit the (+) button as seen on the image below: 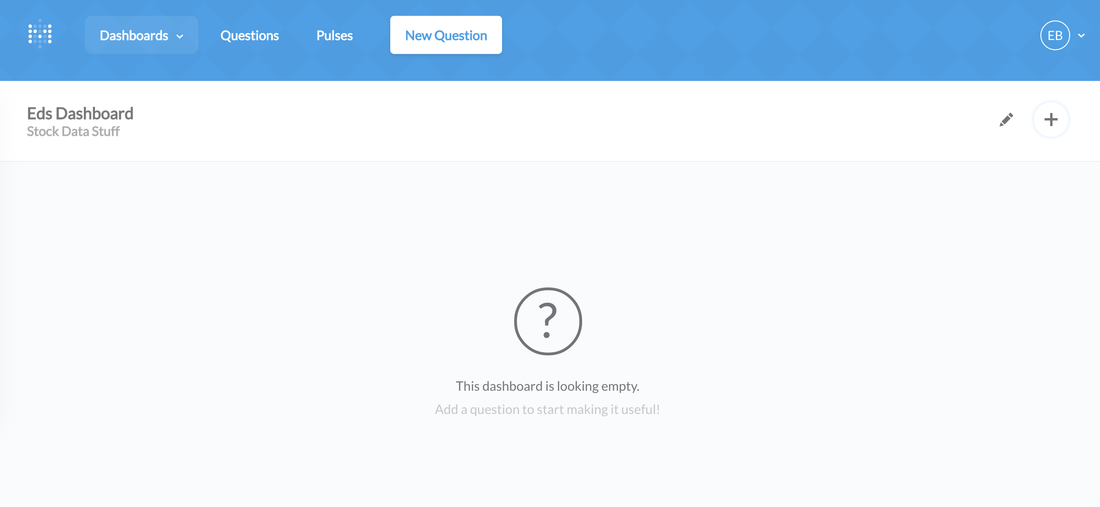
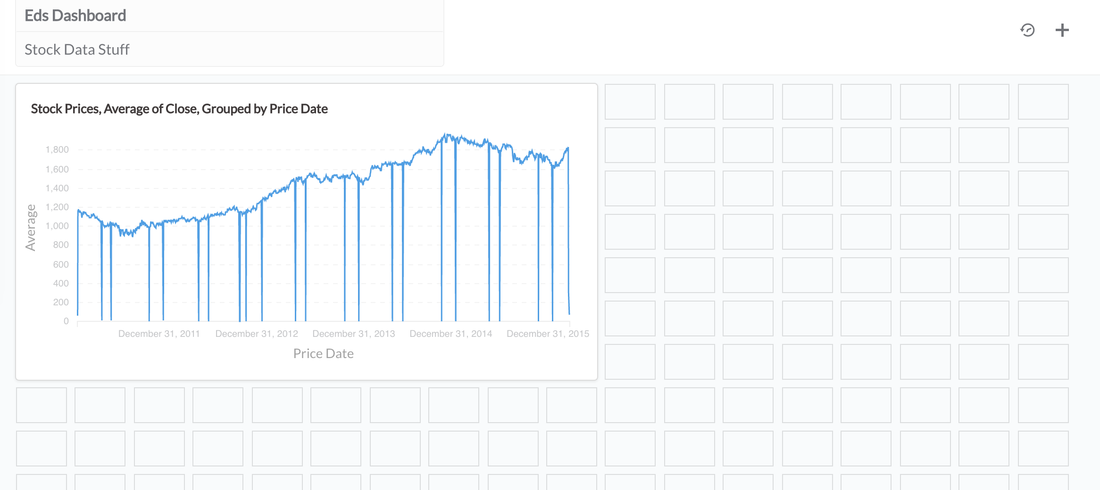
Once a visualisation is selected, you're presented with a grid like system for positioning and aesthetics. This is great to see as some graphs require more audience focus than others.
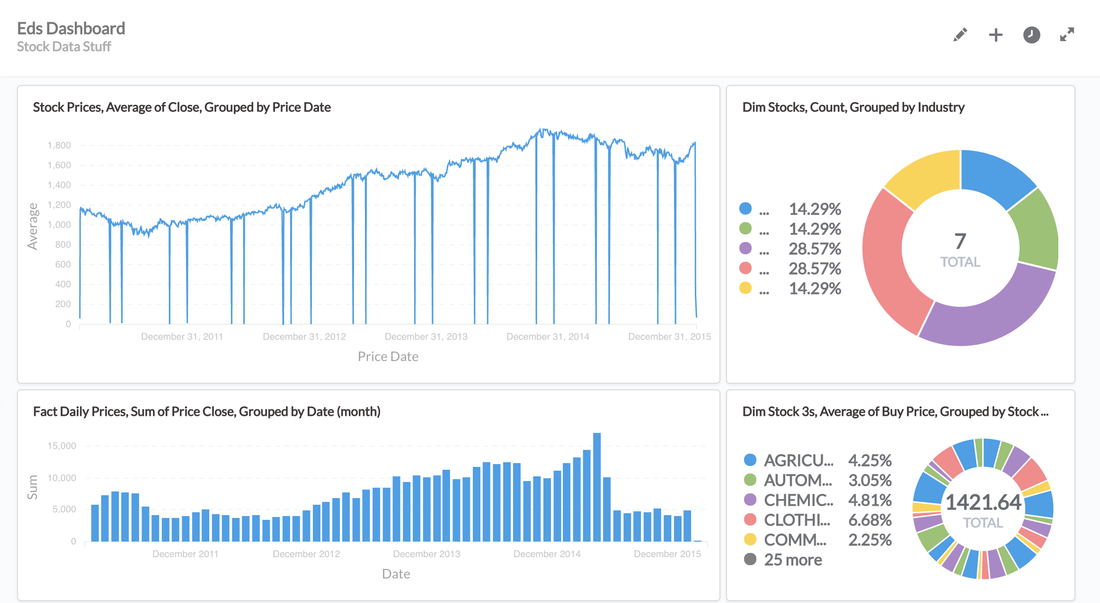
Above you can see a really quick dashboard I setup, it was completely intuitive and took me about 5 minutes to do.
PULSES Another cool feature; Pulses allow you to send data on a schedule either via email or everyones favourite messaging app "slack" 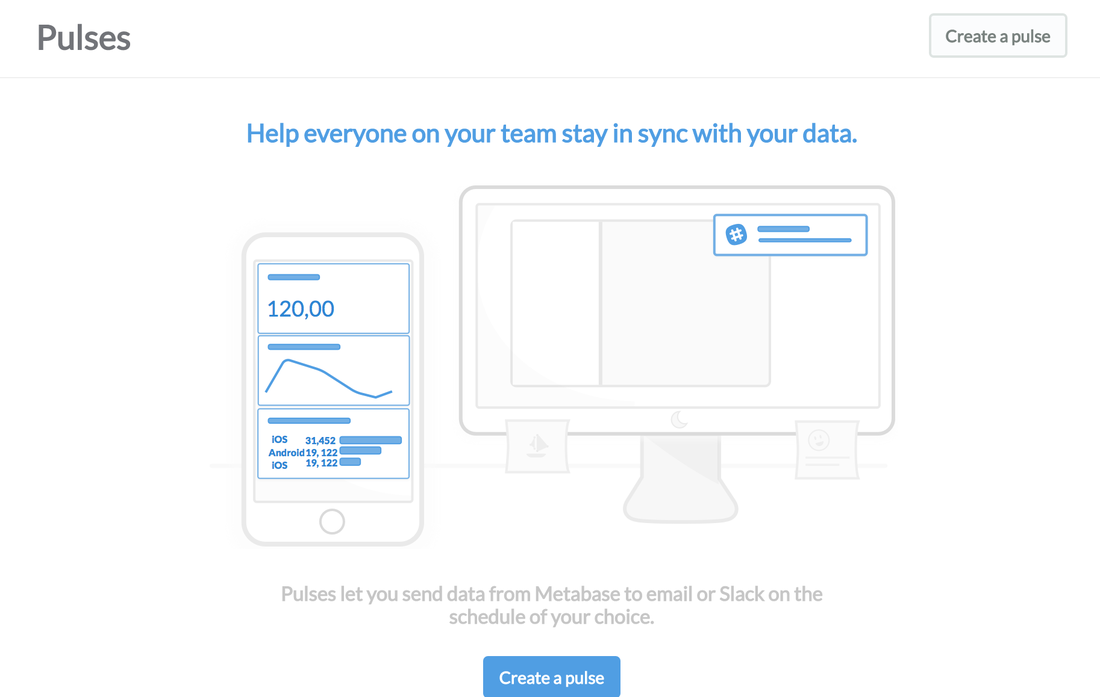
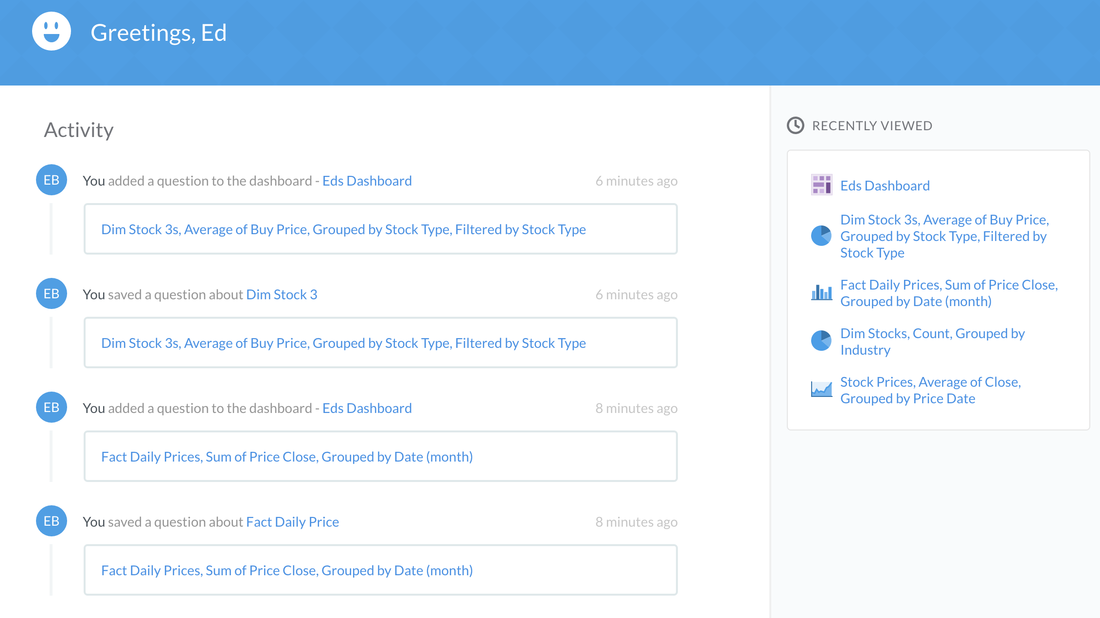
MetaBase provides you with a historical view of changes or activity in your organisation on the splash screen.
What About Power Users?
For people who are SQL experts and want to write some killer SQL Scripts: In the new 'Question" option select "Open Editor" and go crazy! 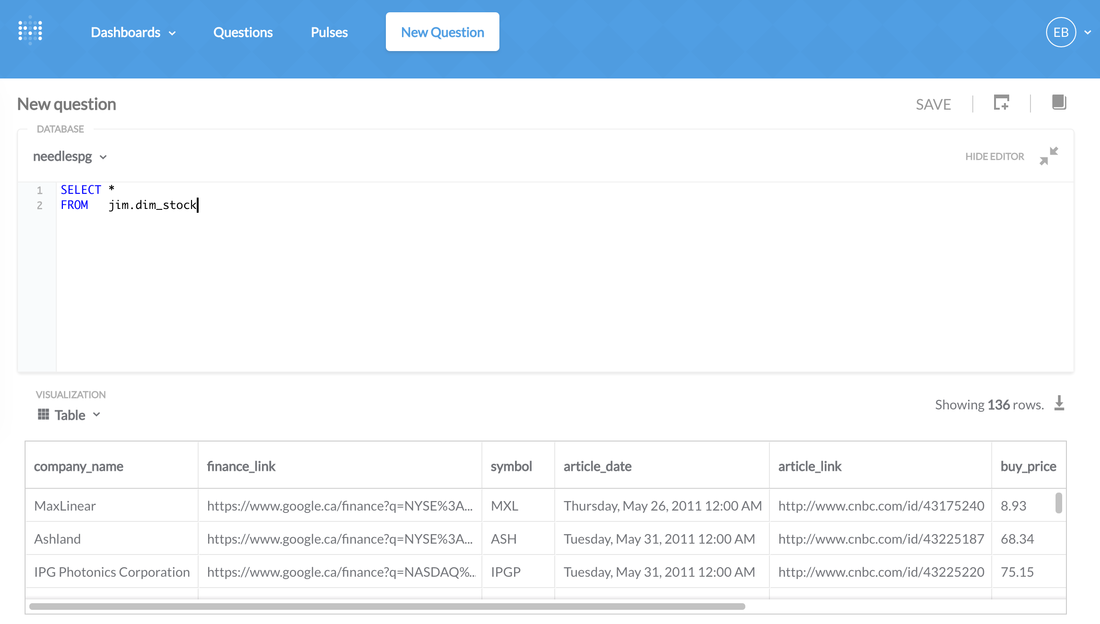
What I loved:
What I would like to see more of:
CONCLUSION This is the best open source visualisation suite I have laid my eyes on. It's extremely well thought out, it's free and is an awesome alternative to paid tools suites like Tableau or Microstrategy. This should be on every startups (people with a budget) list of technology to implement internally.
5 Comments
Ben
4/22/2016 06:30:56 pm
Nice one Ed, might have to play... 9/12/2016 08:16:27 pm
Metabase is good but support for oracle and db2 is a missing part yet. Hopefully this is going to be addressed soon (v 0.20 has oracle support plan) .
Ed
9/12/2016 08:49:06 pm
Zeppelin is more for internal data teams for telling stories in data discovery, Metabase is intended to be used with the whole company in mind, both could be used for the same purpose but they definitely have different roles.
DVious
6/10/2017 09:54:46 pm
I came across Metabase, in comparison to Piwik - the web analytics tool.
Markus
10/7/2017 09:20:22 pm
PIWIK and MB are to distinct product with specific purposes. PIWIK is an on-premise web analytics product that tracks user’s activity based on JS trackers and other APIs. MB is also an on-premise product meant to deliver stunning dashboards based on whats called a collection of questions which is a more business friendly term for ‘SQL Queries’. Leave a Reply. |

AuthorNew Zealand big data nerd, facial hair sculptor and classic car fanatic. Owner of needles.io, freelance big data consultant, ex Activision. Archives
April 2016
Categories
|
 RSS Feed
