|
I'm going to cover how to implement IIS web logs into ElasticSearch via Logstash and nxlog. There are a lot of ways to do this, but in short we need to implement what's called a "log shipper" on a windows server to fire events through to logstash. I see a lot of people online using an install of logstash on each machine, I try and avoid this as logstash is quite 'heavy' in terms of system resource (I have seen many cases where it uses up to 4gb of memory just to send logs). I'm going be using the following versions of Elastic stuff for this post:
Setting up Nxlog First you need to go ahead and download the executable from nxlogs website. The community edition will be all that you need. Nxlog installs in "C:\Program Files (x86)\nxlog" by default. There are two folders that you will become familiar with:
In the conf directory, backup the conf file by copy and pasting, rename to something like "nxlog_backup". In the original conf file remove any default log confs and add the following lines for IIS: <Input iis_1> Module im_file File "C:\inetpub\logs\LogFiles\W3SVC1\u_ex*.log" ReadFromLast False SavePos False Exec if $raw_event =~ /^#/ drop(); </Input> <Output out_iis> Module om_tcp Host put.logstash.ip.address.here Port 3516 OutputType LineBased </Output> <Route 1> Path iis_1 => out_iis </Route> Two bits in BOLD need to be altered: "File" needs to be the location of where IIS is throwing logs to, and "Host" needs to be the IP address of your logstash server. We're not quite ready to start nxlog yet, but that's the windows side mainly done (fairly easy huh). Setup a Config in Logstash Below is my config for logstash, you will notice the GROK pattern is based on how IIS has configured the logs (we will get onto that soon) ##### LOGSTASH CONFIG ##### input { tcp { type => "iis" port => 3516 host => "your.logstash.host.ip.here" } } filter { if [type] == "iis" { grok { match => {"message" => "%{TIMESTAMP_ISO8601:timeofevent} %{IPORHOST:hostip} %{WORD:method} %{URIPATH:page} %{NOTSPACE:query} %{NUMBER:port} %{NOTSPACE:username} %{IPORHOST:clientip} %{NOTSPACE:useragent} %{NUMBER:status} %{NUMBER:response} %{NUMBER:win32status} %{NUMBER:timetaken}"} } } } output { elasticsearch { user => "user" password => "password" hosts => ["elastic.node.1","elastic.node.2","elastic.node.3"] index => "iis" document_type => "main" } } A few things you're going to need to alter: Change the logstash.host.ip.here with your logstash host ip. You also may notice that I have a user and password in my output section, that's because I have shield enabled on the cluster, if you don't use shield just remove those entries. Another important thing to note is the GROK pattern I'm using, if you copy and paste my example you might have a bad time due to your configuration of logstash having more or less log attributes. You can find out your IIS log config by going into your windows server, opening "Internet Information Services" and select the "logging" icon. 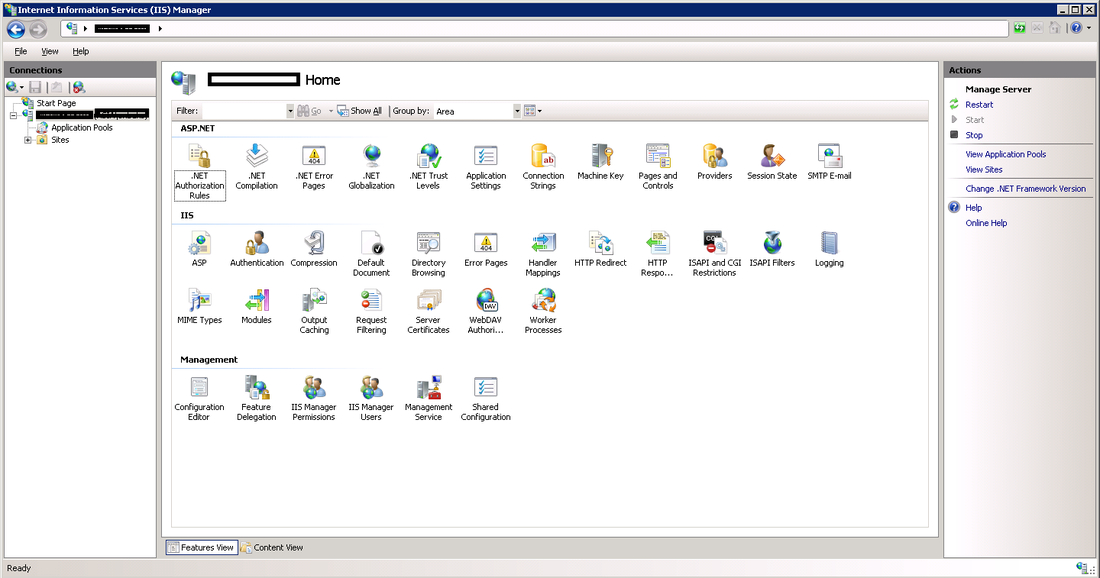 Once you have selected the logging option, click the "Select Fields" button, this shows us what IIS has configured for web-server logs. 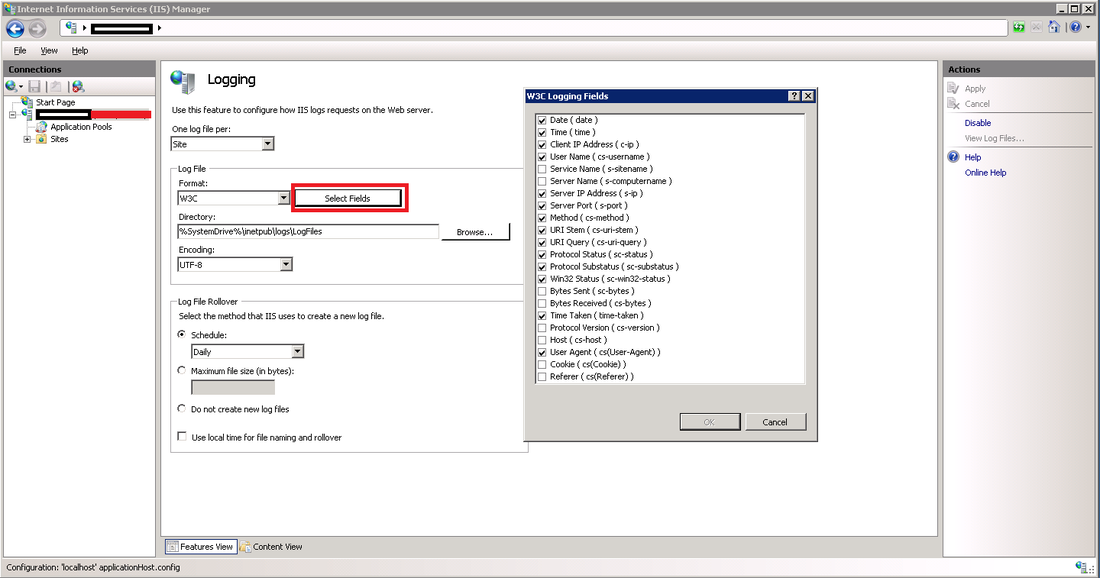 Alternatively you can see the order and fields included in each log file at the top of each IIS log. Check the screen shot below. 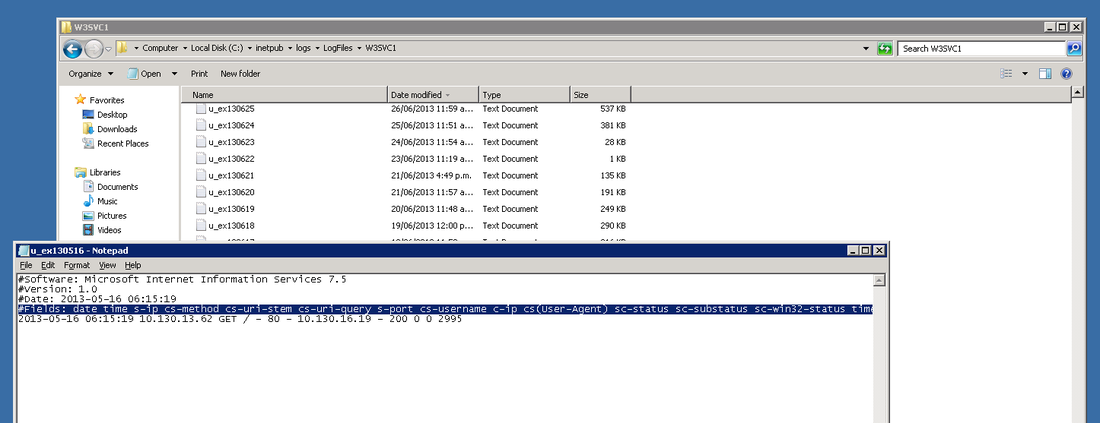 ELASTIC SEARCH INDEX N STUFF Before you fire up logstash, you will need to have an index to write to, first you need to create the index, in my case I have called it "iis": curl -XPUT 'http://your.elastic.server.ip:9200/iis/' I have created a fairly simplistic mapping to go with our index: curl -XPUT 'http://your.ip.address:9200/iis/_mapping/main' -d ' { "main": { "properties": { "timeofevent": {"type": "date", "format": "yyyy-MM-dd HH:mm:ss"}, "hostip": {"type": "string","index" : "not_analyzed"}, "method": {"type": "string","index" : "not_analyzed"}, "page": {"type": "string","index" : "not_analyzed"}, "query": {"type": "string","index" : "not_analyzed"}, "port": {"type": "integer"}, "username": {"type": "string","index" : "not_analyzed"}, "clientip": {"type": "string","index" : "not_analyzed"}, "useragent": {"type": "string","index" : "not_analyzed"}, "status": {"type": "integer"}, "response": {"type": "integer"}, "win32status": {"type": "integer"}, "timetaken": {"type": "integer"} } } }' FIRE IT UP! LOGSTASH Before you fire up logstash, test your newly created config file by running the following command: sudo /etc/init.d/logstash configtest If all passes, you can start up logstash by running: sudo /etc/init.d/logstash start Remember, if things start to go awol, you can check the logs for logstash by running the following command: sudo tail /var/log/logstash/logstash.log NXLOG You can startup nxlog through powershell or through the services manager. 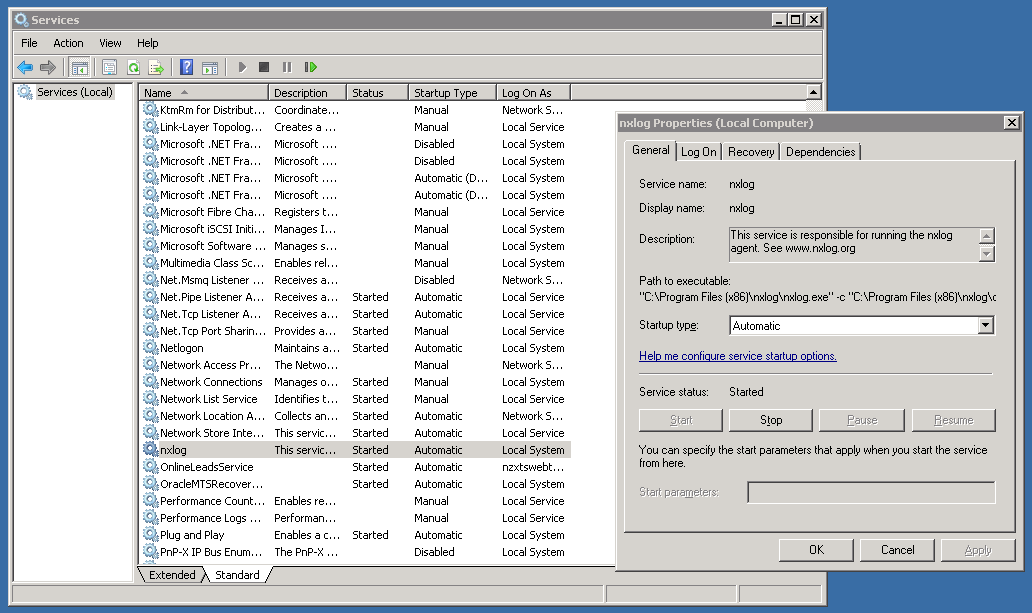 See if everything is working by checking the size of our index in Elastic by running: curl 'your.elastic.ip.address:9200/_cat/indices?v' 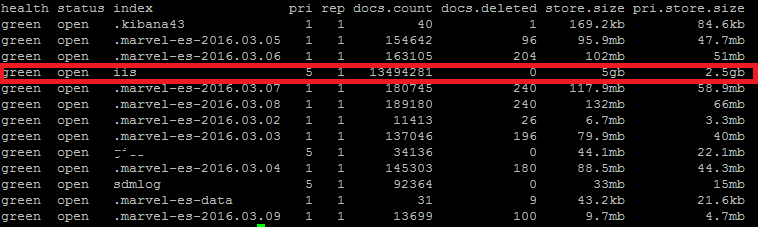 That's it folks: If you're using Kibana you can make a real pretty dashboard to display what's happening in real time on your web-server (here's one below I made in about 20 minutes): 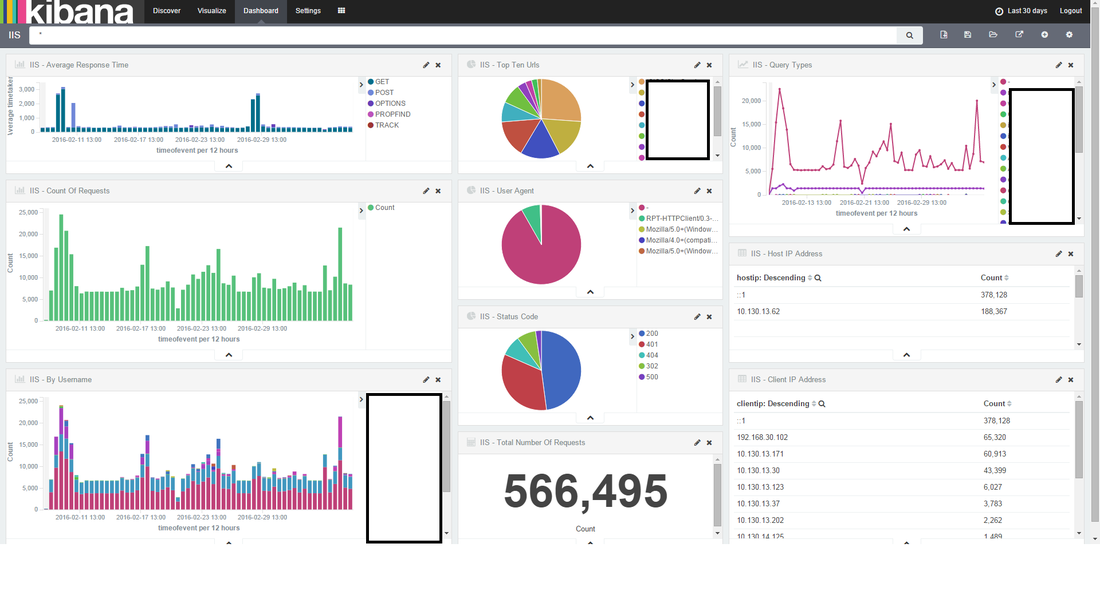
0 Comments
Leave a Reply. |

AuthorNew Zealand big data nerd, facial hair sculptor and classic car fanatic. Owner of needles.io, freelance big data consultant, ex Activision. Archives
April 2016
Categories
|
 RSS Feed
