|
INTRO: Riot games is responsible for making one of the worlds most popular games, "League Of Legends". I would bet my bottom dollar that the team at Riot have a fairly large data warehouse, probably something like Hadoop and/or a flavour of MPP database. What's interesting about "transactional" data warehousing is it can monitor when an event starts or stops happening, but it struggles to tell you why. Within the last 10 years most games have an online component whether you notice it or not. With the advancement of connected consoles and PC's, companies are able to fine tune their games years after the initial release date using updates (referred to as patches). In League of Legends you can play as a certain "Champion" . Champions have different attributes, some may be better at defence while others are better at offence. Reading through the patch notes supplied by Riot they are continually tweaking each champion. Although I don't have the transactional data from League of Legends, I do have a good slice of social media data for late 2015, all in all about 5,000,000 comments. I'm going to show why tracking your customers feedback is almost as important as tracking transactional event based data. THE SETUP:
THE DEEP-ISH DIVE: Note: A Champion is character you can play as in League Of Legends 1.0 This graph below is showing the count of comments that mention any "Champion" for the month of November. 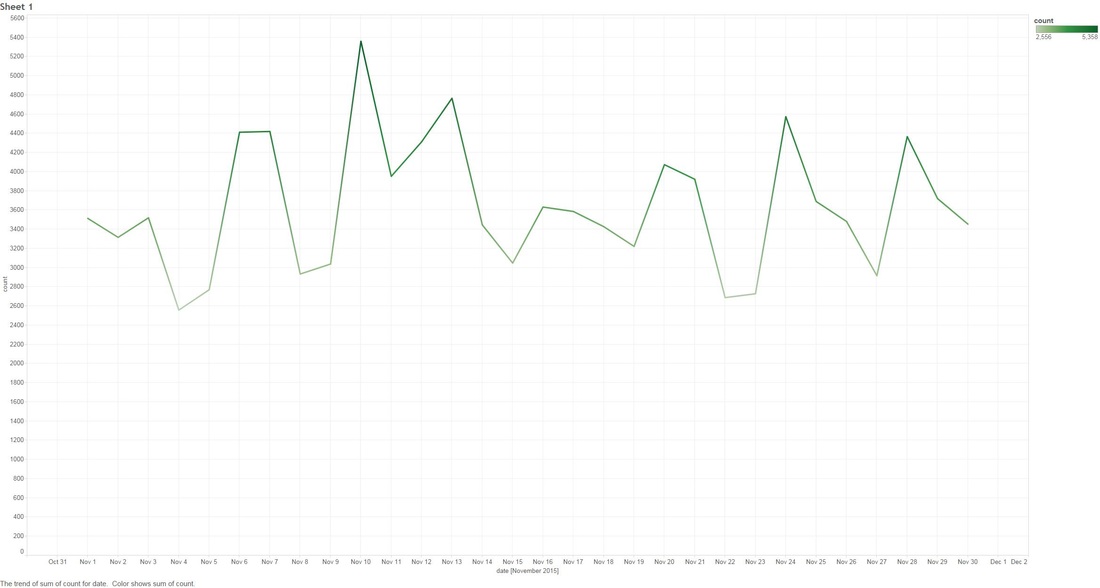 1.1 Next we look at specific group of Champions that were tweaked in the patches. The graph below shows what percentage of all Champion comments these dictated over the month of November. 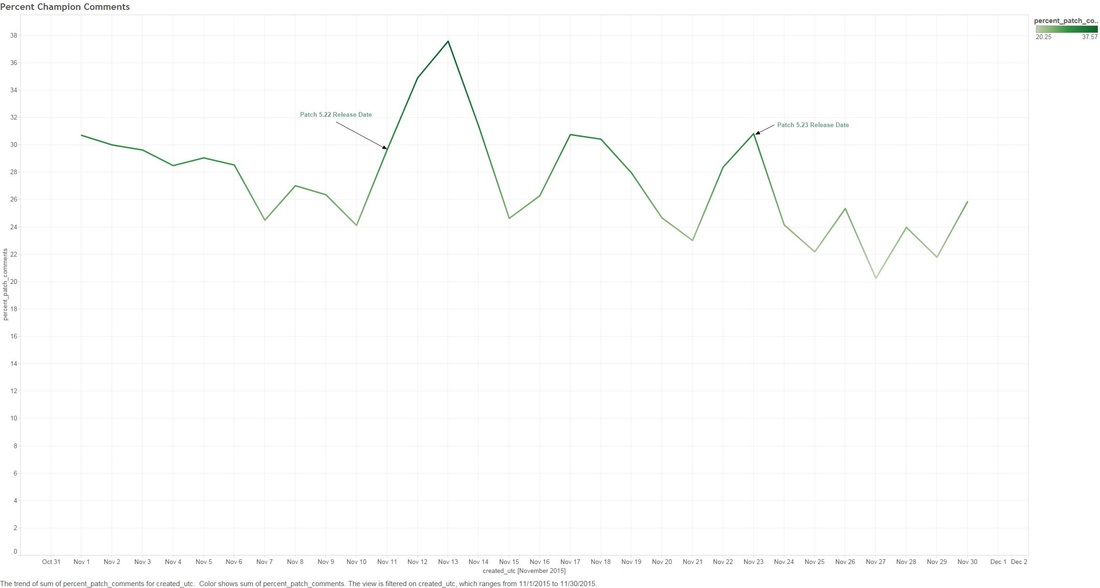 Two date ranges we will look into with noticeable peaks: (10-Nov to 15-Nov) and (21-Nov to 24-Nov), which strangely enough are around the release date of our patches! 1.2 - Here we look at the count of Champion comments between the dates (10-Nov to 15-Nov) and (21-Nov to 24-Nov). Orange means the champion was updated in the patch and Purple means it wasn't. Patch 5.22 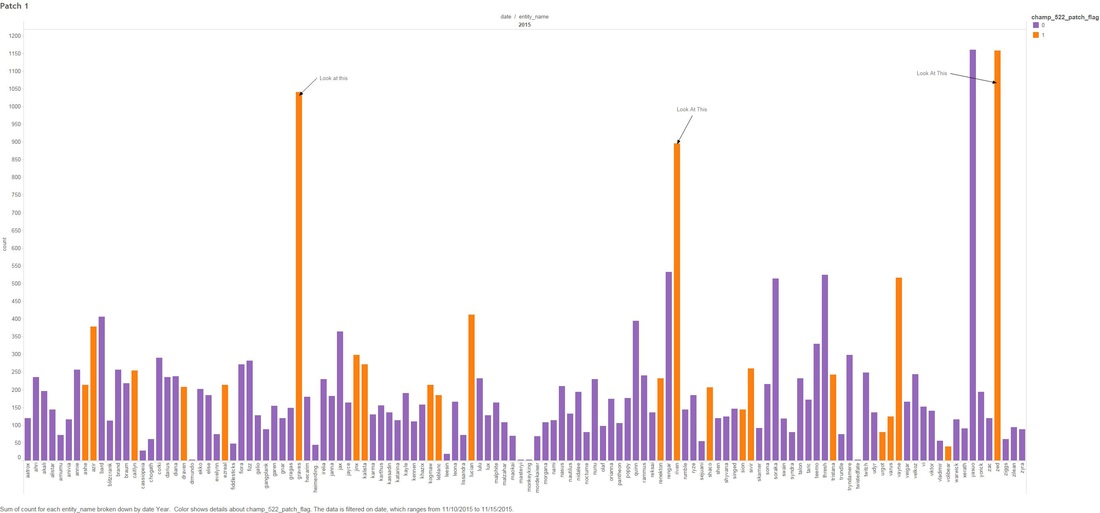 Patch 5.23 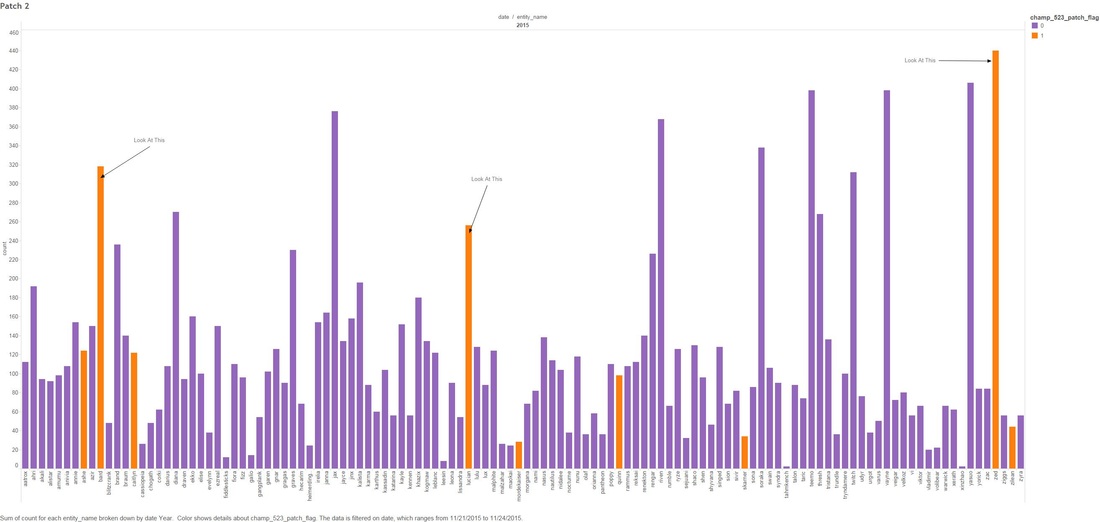 You might have noticed that I have annotated a couple of Champions in each of the graphs. I'm going to take a closer look at these. Some champions dominate comments threads more than others by being more popular or more controversial, we should take this into account when digging in deeper. 1.3 - We attempt to weed out the dominating Champions from our selected list Percentage Of Comments Grouped by Champions - All Time 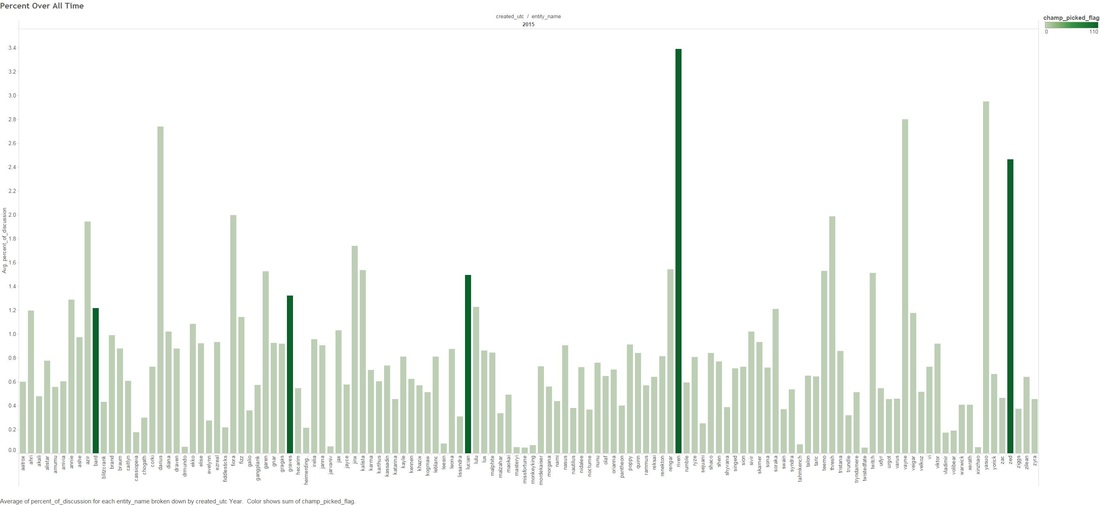 Percentage of Comments Grouped by Champions - (10-15 Nov) 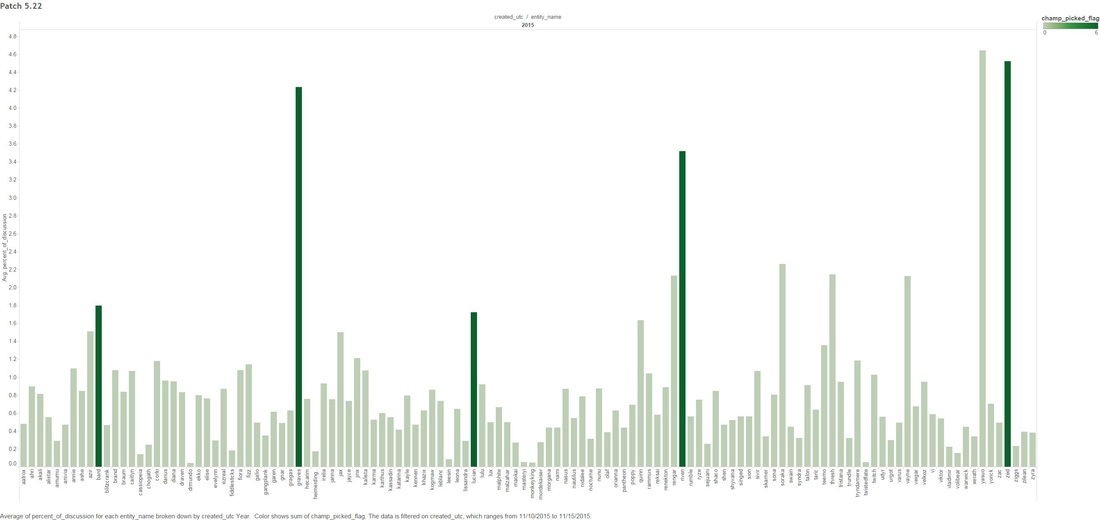 Percentage Comments Grouped by Champions - (21-24 Nov) 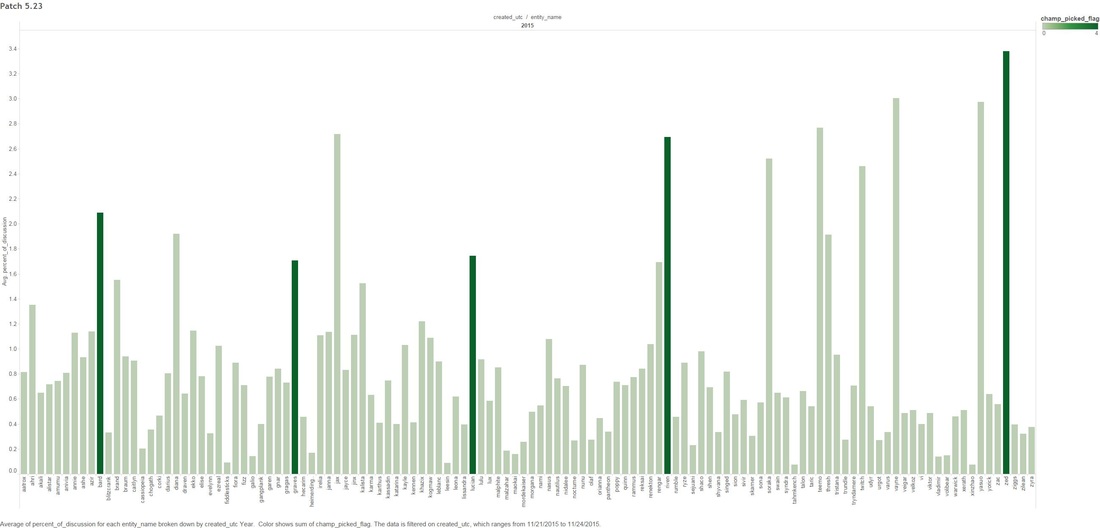 Using the an example of the Champion Bard, you can summarize the above three graphs:
The most prominent mover in % gain is the Champion "Graves", I think Graves warrants some special attention (especially during the Patch 5.22 period). 1.4 - Count of Champion "Graves" Comments Over Time 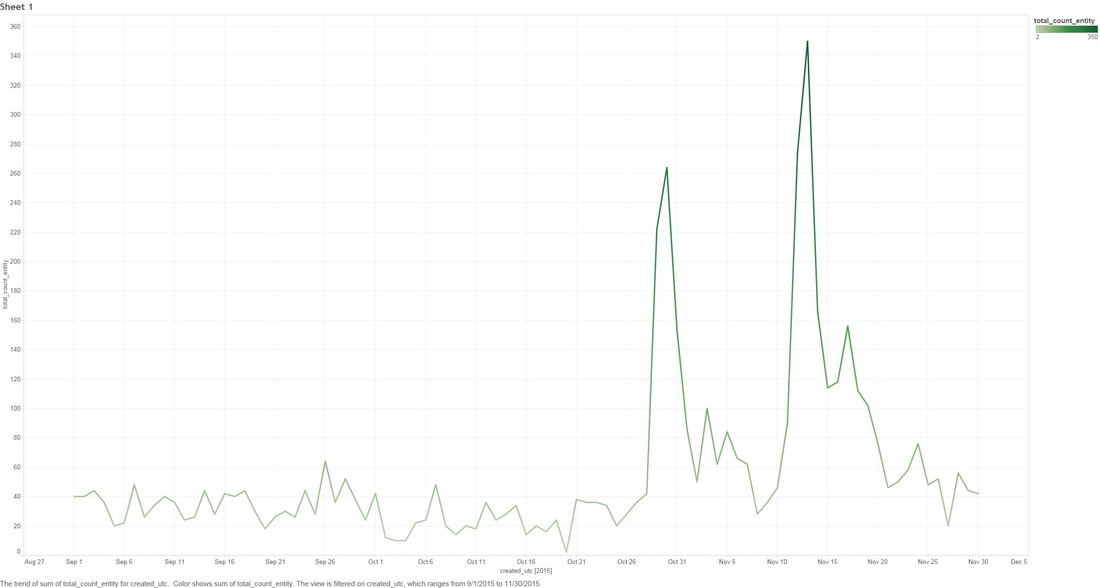 All the tedious work above of filtering things out has paid off, we can see two very obvious spikes for Graves one of which covers patch 5.22. Next we will use an algorithm that detects noun phrases in comments for the period 10th to 15th of November and determine which appear most frequently. 1.5 Noun Phrase Frequency For Champion Graves between 10-15 November. 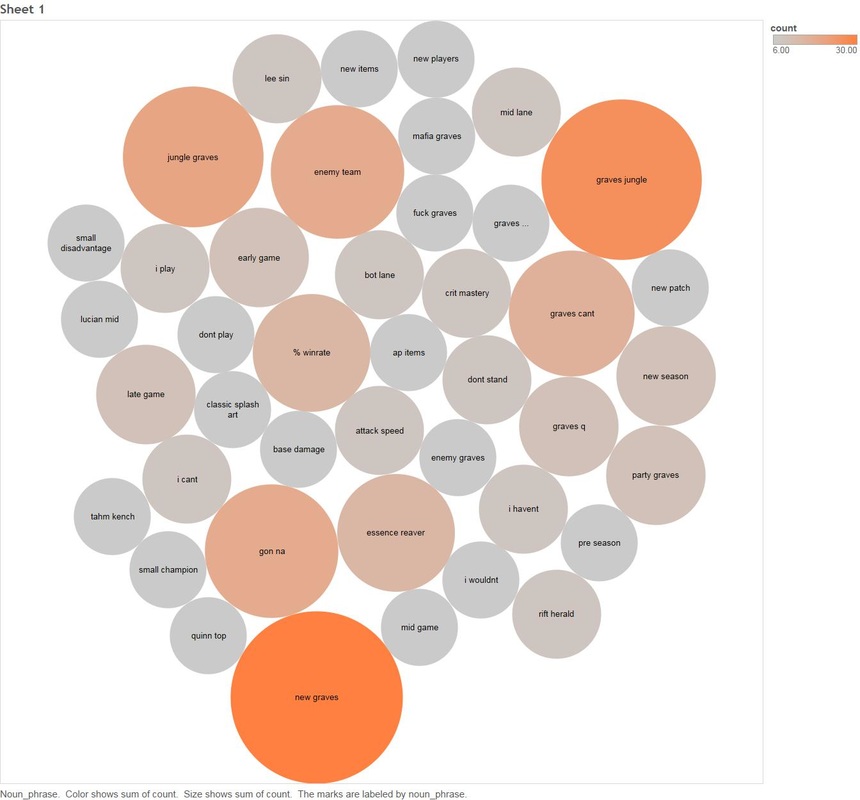 Looking at the data we can see that there are some obvious hot spots in noun frequency, particularly "jungle" Next we will have a look at comments between the same time period that also talk about other Champions. 1.6 Count of Comments Mentioning Graves Between 10-16 November that also talk about other Champions. 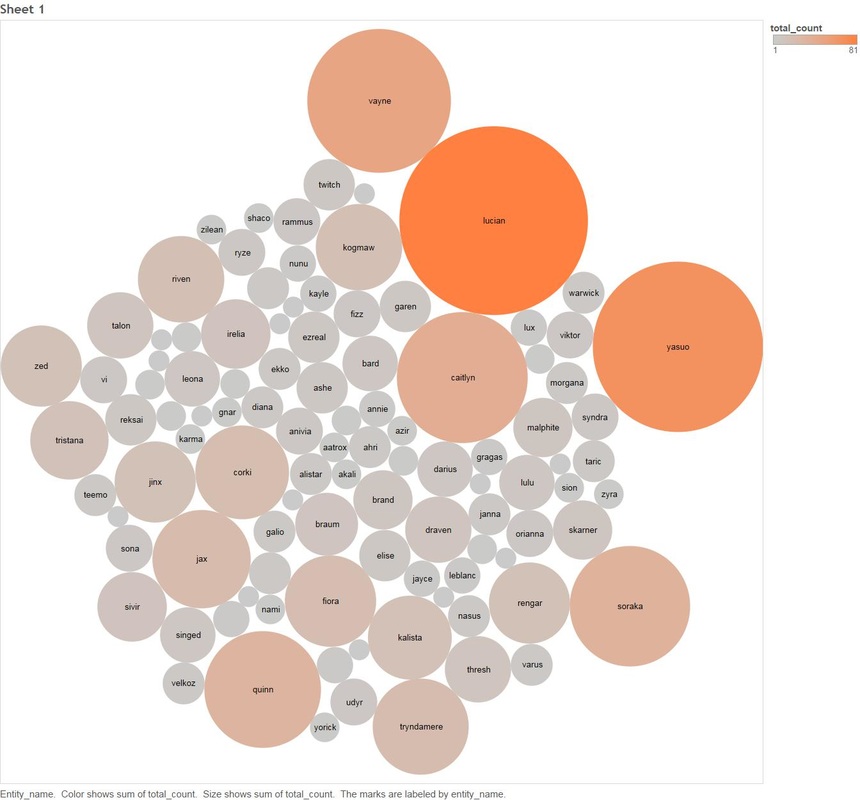 Now we will also cross relate any comments that mention graves for the same period and mention any other entity in the League of Legends Universe 1.7 Count of Comments Mentioning Graves Between 10-15 November that also talk about other League Of Legends Entities 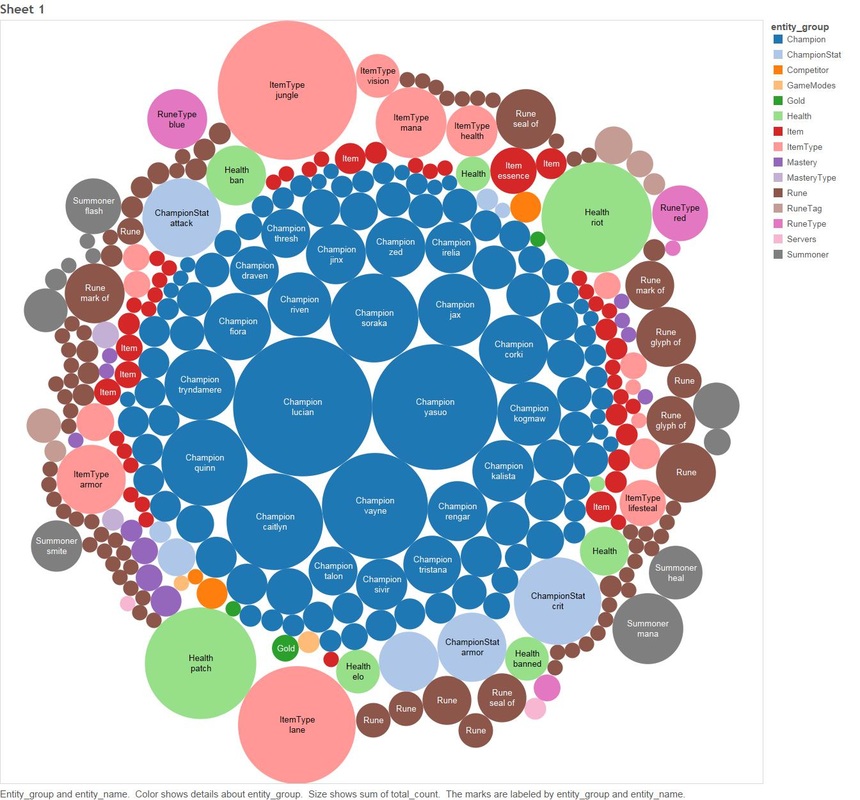 This visualisation shows:
I'm still on the fence regarding sentiment analysis and its accuracy, you can find plenty of articles covering this topic online. For the sake of doing it, I decided to run a sentiment algorithm on all comments that mention Graves and also other League of Legends entities. 1.8 - Sentiment Analysis Of Comments Mentioning Graves by All League Of Legend Entities. 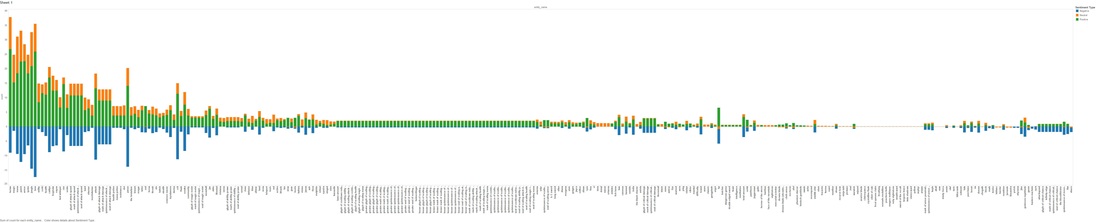 This graph is fairly large and hard to consume, lets split it out by the top Positive and Negative counts Negative 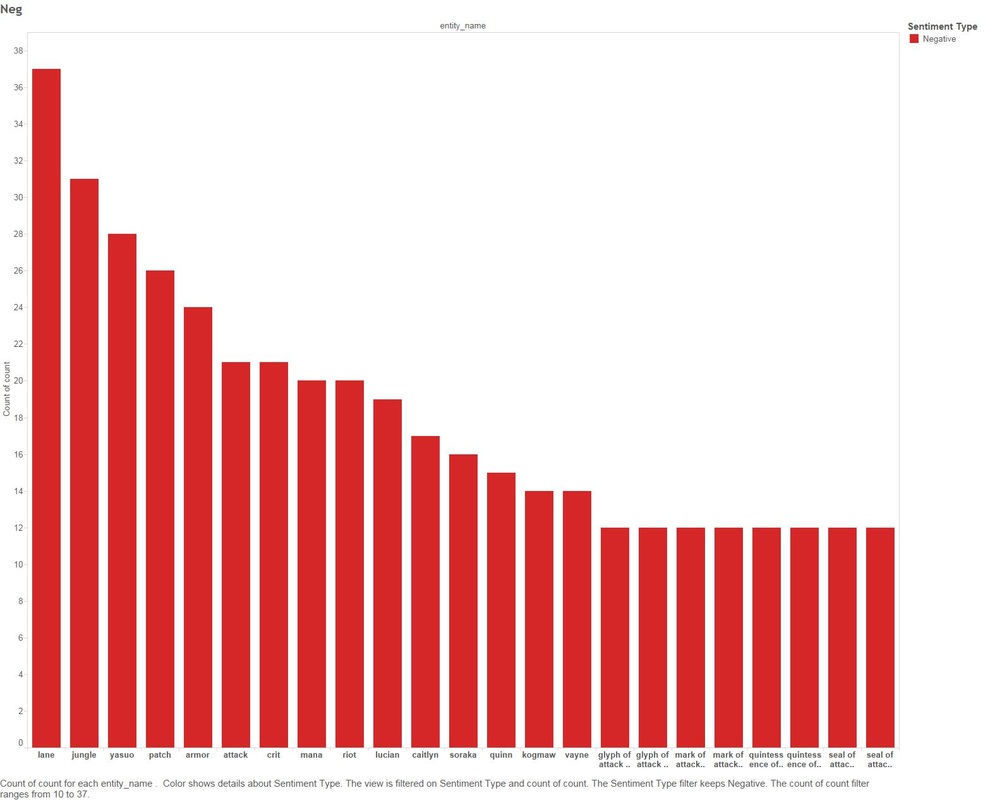 Positive 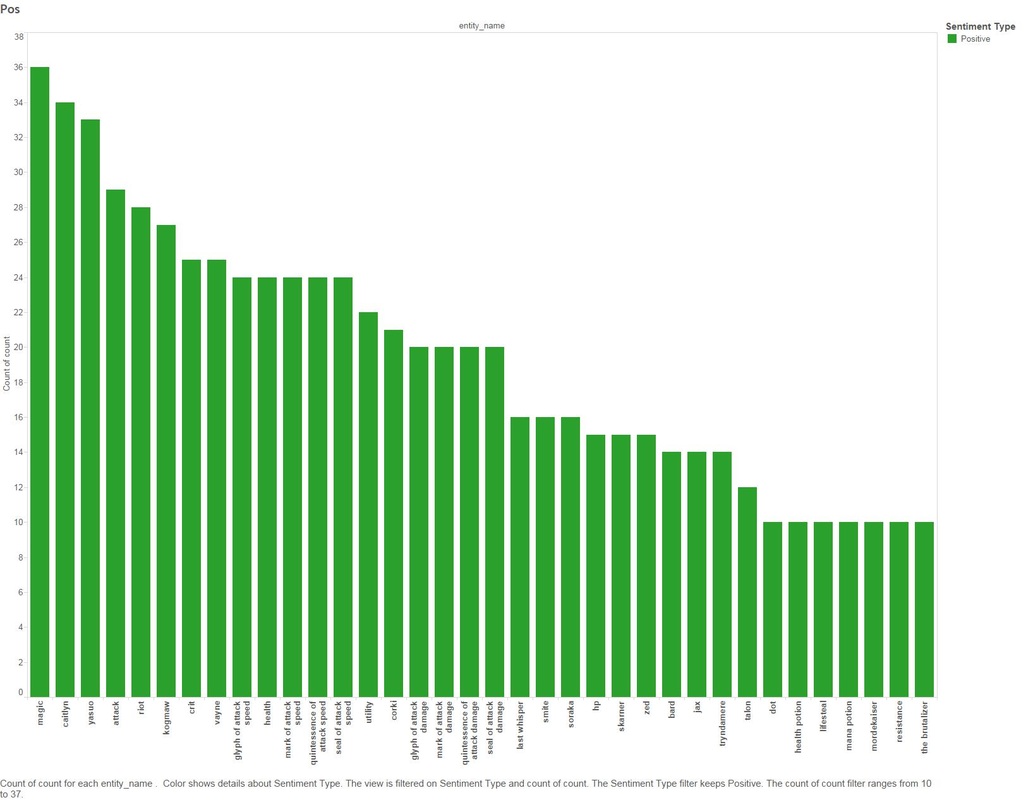 We are starting to tell a story without even looking at the comments (yet), below are a few examples:
Next we will look at the key words people are saying when they talk about Graves, Jungle and Lane 1.9 Count of Key Words In Comments Graves and Jungle 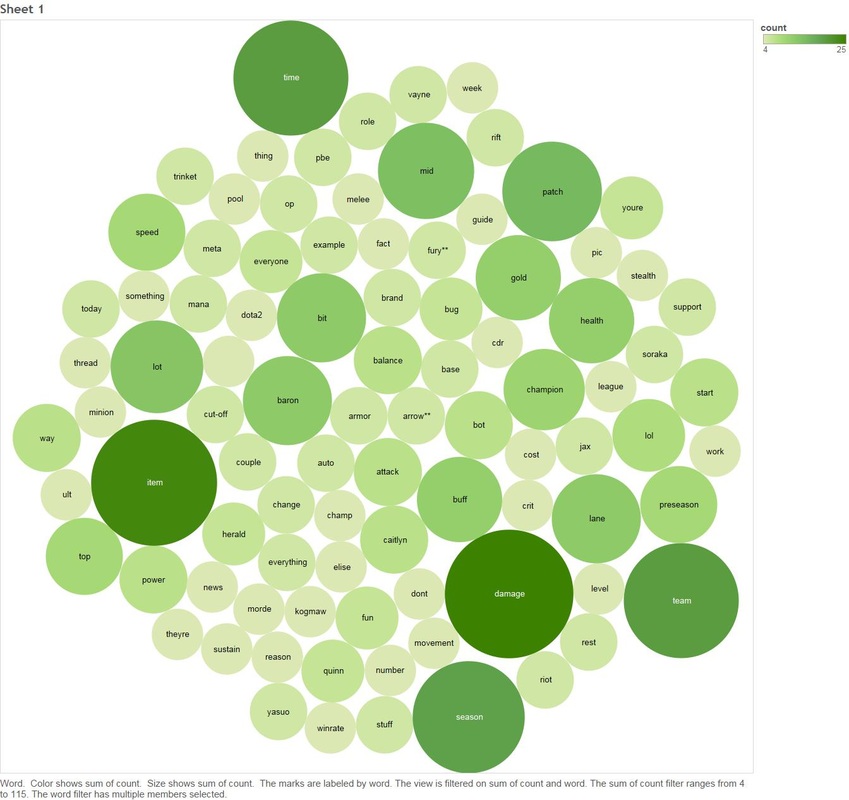 Graves and Lane 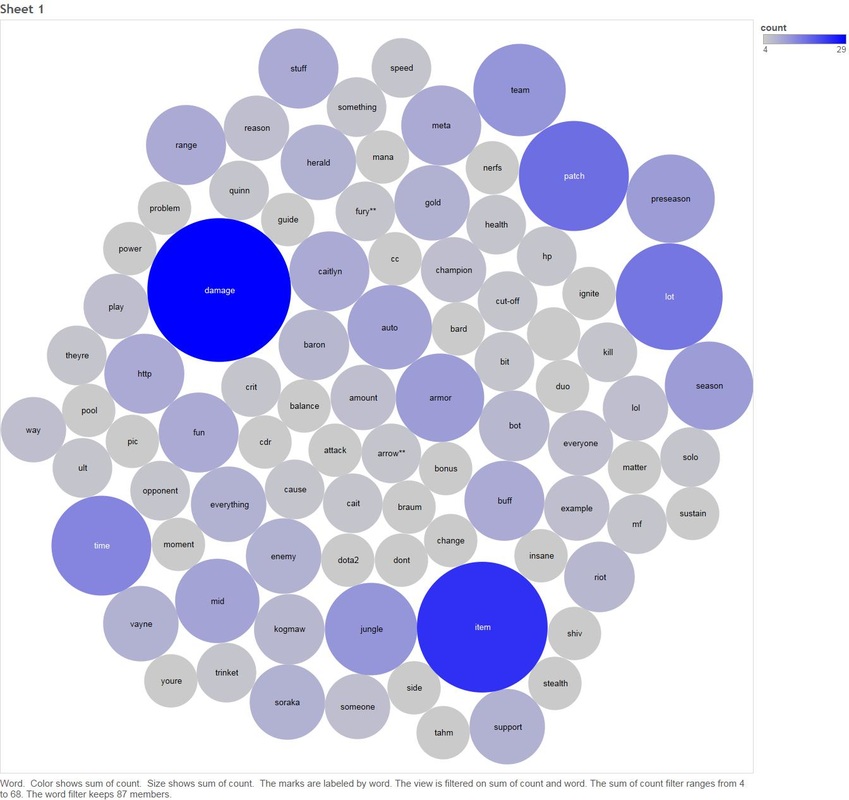 There are two clear themes between both Lane and Jungle - people are talking about damage.
Lets look at some of the raw comments that we filtered down to people who talk about "Graves", "Lane" or Jungle" with the key word of Damage (there are a lot, so I will track down only a few key ones that resemble the story of the rest) Comment #1: His Q does a ton of damage and has a pretty flexible mana cost. if nothing else, his Q is too strong already in terms of waveclear potential. on top of that, a lot of powerful graves play is coming in the solo lanes and jungle Comment #2: They were weak because the meta was very heavily against them. TP was very strong so you often saw the two solo lanes run it and its low cd allowed them to go bot just about any time they pleased. The adcs that are meta rn, Graves, MF, Luc, Cait were lane bullies that werent viable due to how much they would get punished for pushing. Now if they get ahead, they snowball the game and become an issue, thats what lane bullies do, thats what Renekton does if he gets ahead, thats what LB does if she gets ahead. If the scaling ADCs are allowed to scale (Vayne, Jinx, Trist) they become very strong, but games often end before they have their items, so the lane bullies are the ones that seem broken. The ones that are a little strong are being toned down, but this is fine. The meta was not adcs carrying last season, this is why Sivir has a Victorious Skin, because they were basically damage supports, now they carry if they get ahead, its not any different than any other lane. Comment #3 So I just played my first game of the new preseason and it was interesting.I played a quick blind pick game as Warwick jungle. I quickly realized you cannot 1v1 the rift herald even as Warwick, not even at level 9. The thing does crazy damage it felt like at least.So I faced 4 ADCs on the other team, Im guessing people really wanted to try out the new items and Marksmen update, I just hope thats not a regular thing I run into. Someone on my team had Graves and was wrecking, really cant wait to try him out. Seems really good right now.Almost everyone was running Warlords Bloodlust as their keystone, but 3 people didnt even have a keystone set. I think thats about it. I went 11/6/2 and we lost at 30 minutes. Comment #4 Main support here. So its kind of hard too say when you want to take Ignite or exhaust depending on your match-up, so lets create an example. You said who you play, so lets create a random I dont know, Bard, Vayne. Dont know why that came to mind anyway. Depending on the other match-up youll want to decide quickly, as Bard Vayne you have a lot of potential to rip someone in lane very quickly, I tend to see Bards take Ignite, if Im playing Bard I normally take ignite too, thus doesnt answer your question however, so Ill take it into a more easier break down, you should take exhaust if you dont want your ADC to get ripped apart by an all in team (this is where supports make mistakes) Your ADC should be your main form of damage so if your ADC is squishy (Vayne, Ez I might say put Graves in there with changes) Youll want to take exhaust I think I missed some but you should be seeing the point, if your ADC is something like; Cait, Lucian, Draven, Trist you probably want to take Ignite just because of the power you have in lane but it also depends on the ADC and there support if you see something like Braum, Lucian you instantly want to take Exhaust as theyre very bursty and can destroy your lane again as Annie Kalista, this probably makes no sense but if you have anymore questions you can respond and Ill answer them the best I can :P I kinda hoped this helps although it probably didnt make much sense . I could go on, unless you're a League Of Legends player or work at Riot games this might not make any sense to you. CONCLUSION: If you got this far, well done! It can seem a little bit boring if you don't know anything about gaming or even League of Legends. In summary this is what we did:
You might be asking yourself "I can look at forums, Reddit or twitter on my own and figure this out!". Well what you're not taking into consideration as humans we are attracted to emotional statements, for example something like: "OMG MY PING ON LEAGUE OF LEGENDS SUCKS", because it's all in caps and contains strong sentiment.. we fall into the trap of thinking this is important, but there is a chance this player lives in a remote village and on dial-up. Unless you can aggregate these themes it's hard to trust them or yourself. It's also an extremely easy way for people working on a specific problem to access a specific entity and drill down on key words to help them design and build better features. This analysis would have been really fun to marry together with transactional data, imagine having access to information like Champion churn or Effectiveness from game-play (one can only wish!). PS - If you're interested in the tech used: Java, Python, SQL, Postgres were the main ones.
0 Comments
INTRO:
I'm going on a little bit of an open source visualisation review stint. Last week when I reviewed Zeppelin I came across metabase. When I looked at the UI and visualisation screenshots I was a little blown away on how gorgeous it looked, usually with open-source anything you're faced with engineer lead designs and to be fair.. engineers aren't generally good at making things look good (gives engineers a hug). WHAT IS METABASE? The one liner from the github account says: "Metabase is the easy, open source way for everyone in your company to ask questions and learn from data." After getting under the hood I have found that it's a great replacement for tool suites like Tableau Server or Microstategy. The whole focus is about enabling a data centric organisation, you can tell the contributors have focused deeply on enabling the average user with the ability to deep dive into data without even being close to a SQL power user (easier than excel!). THE INSTALL: My setup is the usual 14.04 ubuntu VM, I also have hosted postgres, mysql and neo4j. So if you're following these steps and you're using a different OS flavour you will need to alter the commands. They say it's a 5 minute install, so I'm hoping this section is pretty small! Download the package (always check for new versions) wget http://downloads.metabase.com/v0.16.1/metabase.jar
Run it
You can tell from the command that metabase is Java, so you're gonna need to have that installed. I'm currently running "Java(TM) SE Runtime Environment (build 1.8.0_51-b16)". You can see your version of Java by running "java -version" on the command line. Ok let's crank it up: java -jar metabase.jar
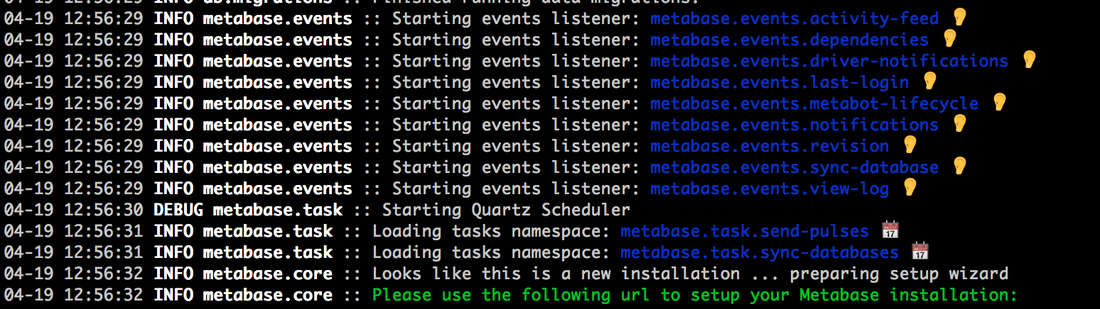
I think that's the first time I have started something open source without a failure on the first attempt. You get a terminal full of messages like this one:
LETS GO EXPLORING! By default metabase starts on port 3000, I navigated to "http://192.168.1.21:3000" (obviously change the IP address to whatever your host is on): 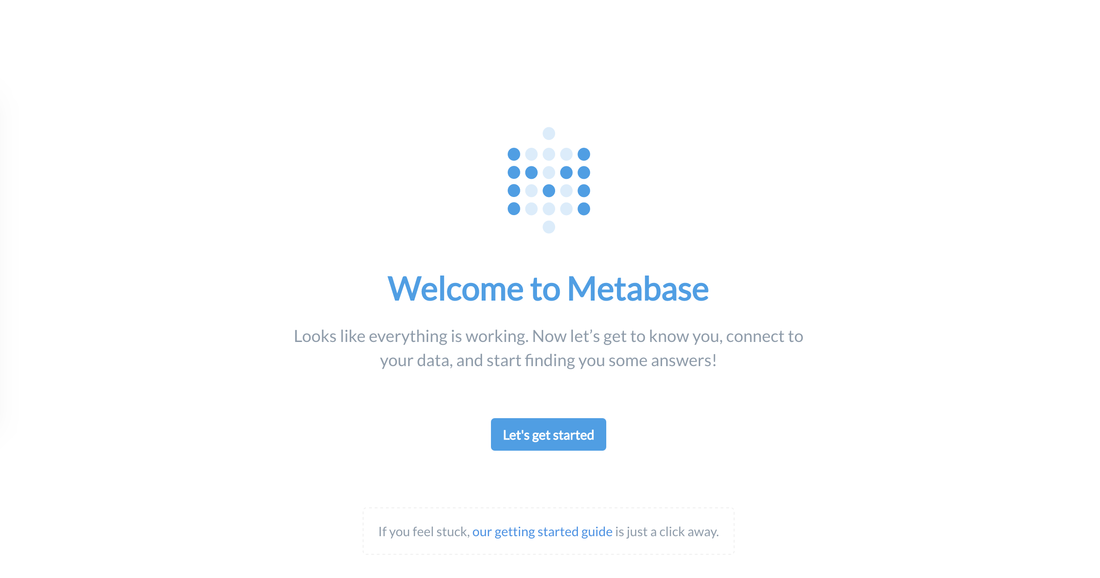
After I select "Let's get started", it's already asking my for account and login creation information. This makes me very hopeful that there is good integrated account management.
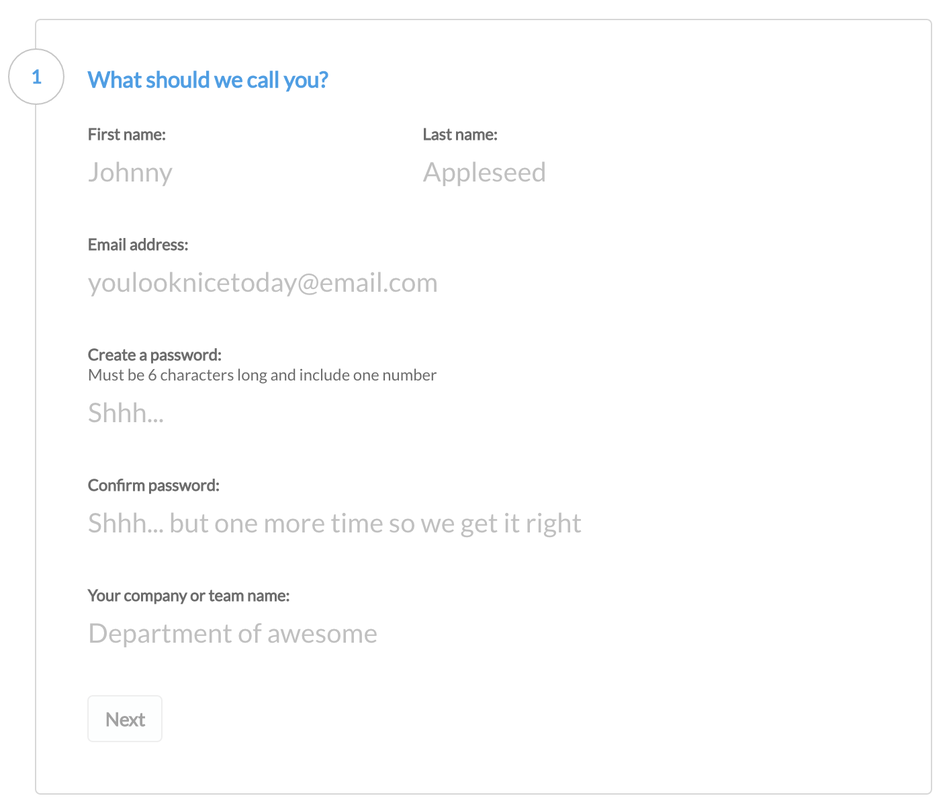
After the login information is complete, it's asking me to setup data sources. You can see it supports a good amount of standard data sources (sql server, postgres etc) and big data tech (redshift, mongo, big query) which is awesome. I'm going to go ahead and connect up my postgres instance.
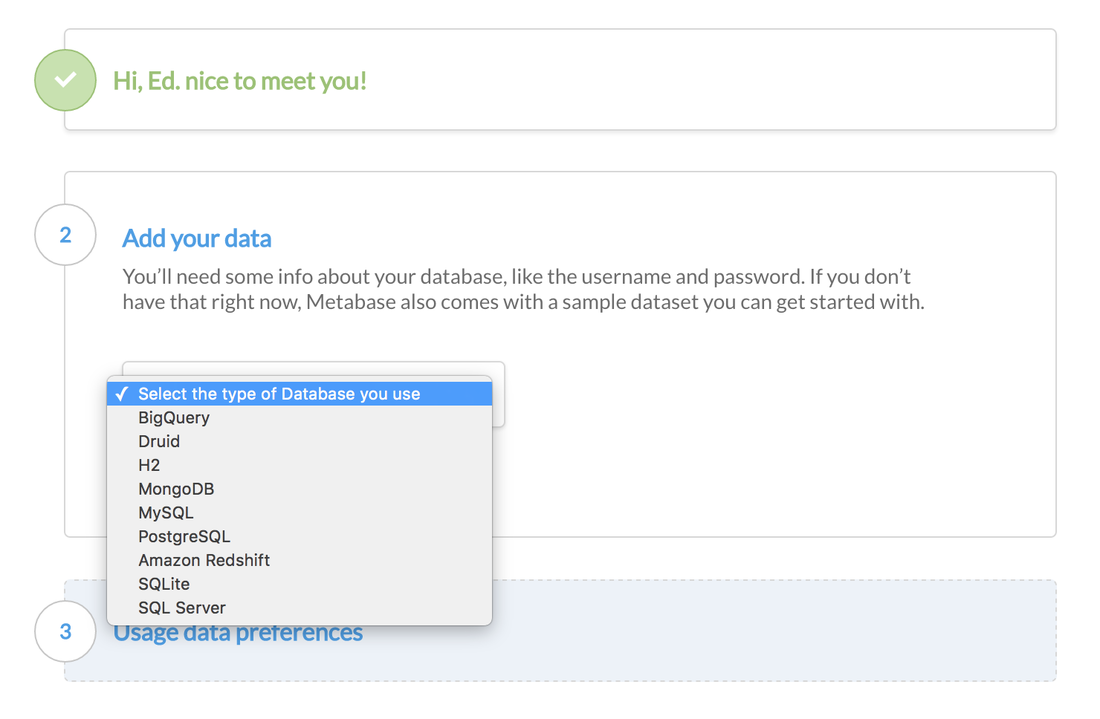
After I setup my postgres db, it's giving me the option of allowing metabase to collect information on tool usage, you can opt out if you wish.
I'm presented with some nice messages helping me on my MetaBase journey (again.. kudos to whoever is doing the UI/UX)
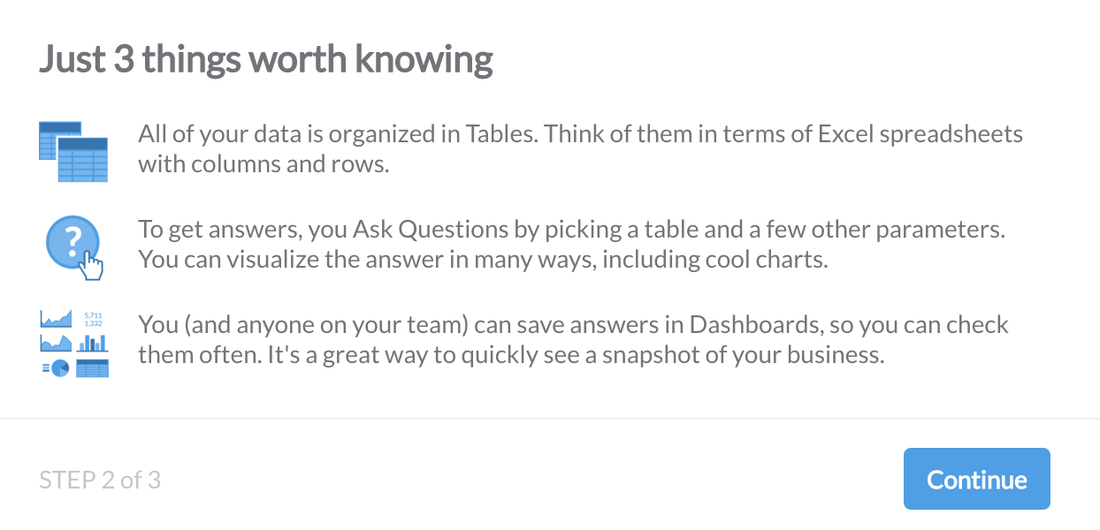
MetaBase has a sample dataset to get started, so if you don't have a DB to connect to you can still evaluate MetaBase. When you first login to Metabase it will take you on your first query tutorial.
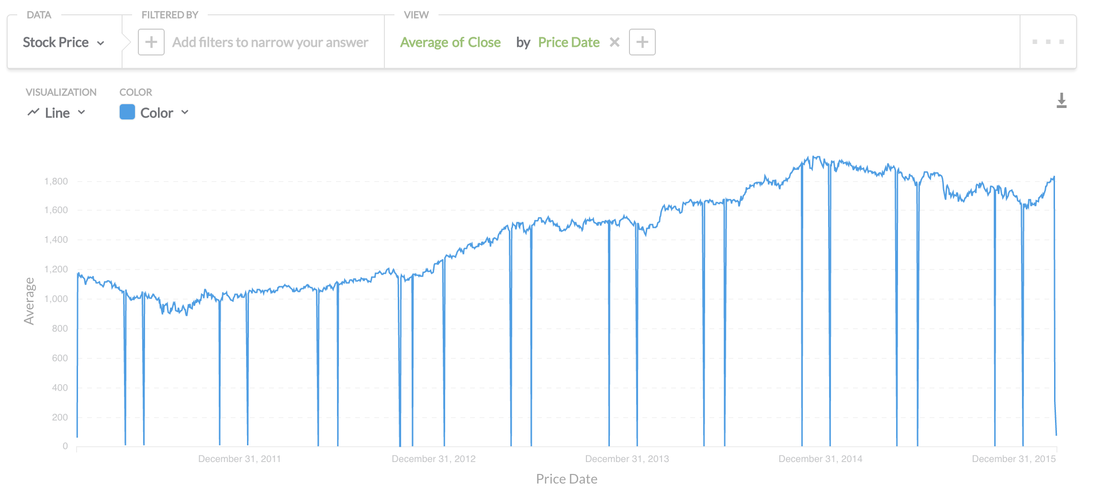
MetaBase uses the terminology of "Questions" which I assume they are attempting to take away technical terms like "Query" to open to the door for non technical people to feel comfortable with exploring datasets. I'm going to have a go at running a query against my stock database on postgres. 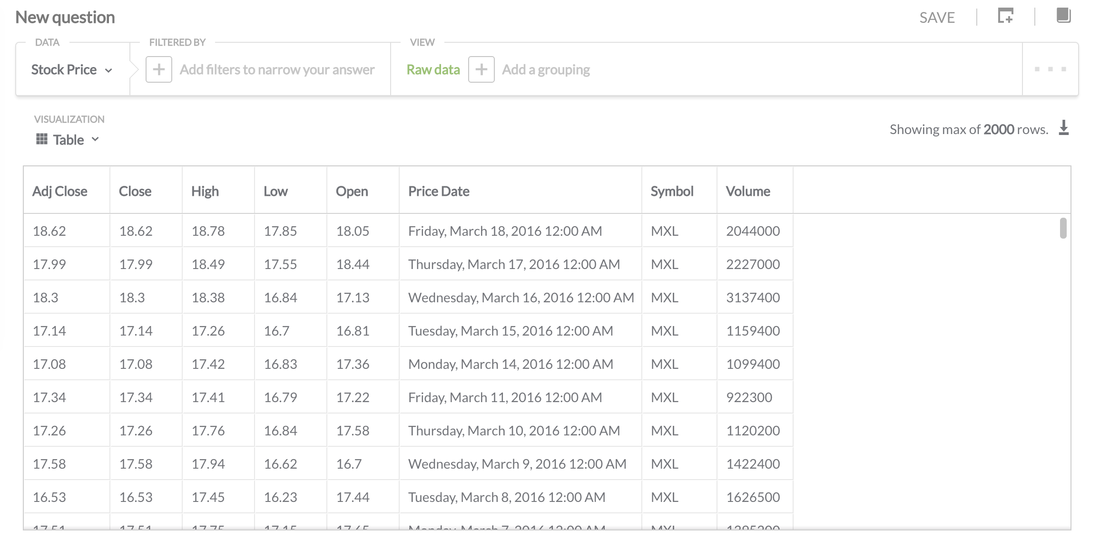
There's nothing fancy going on with this, it's as simple as looking at the raw data. Being a SQL guy for 15 years I have to get my head around the simplified terms to query the data (But I can see that someone without experience would pick it up quick).
If you're an excel power user, you can download the data directly from this page by selecting the download icon towards the upper right of the above screen shot. 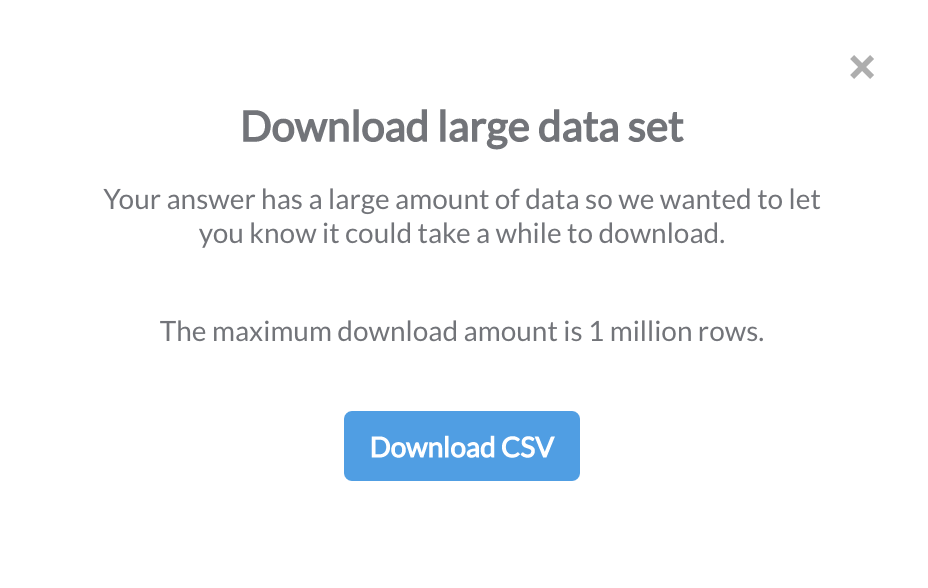
Once I selected the download option, it warns me that the dataset is large and the max I can retrieve is 1 million rows (which will probably crash excel anyway).
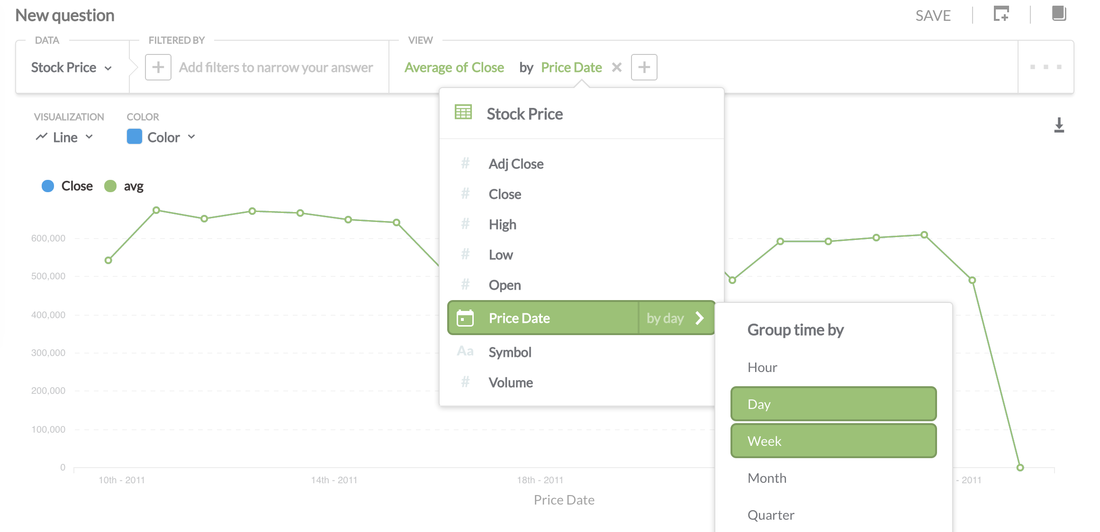
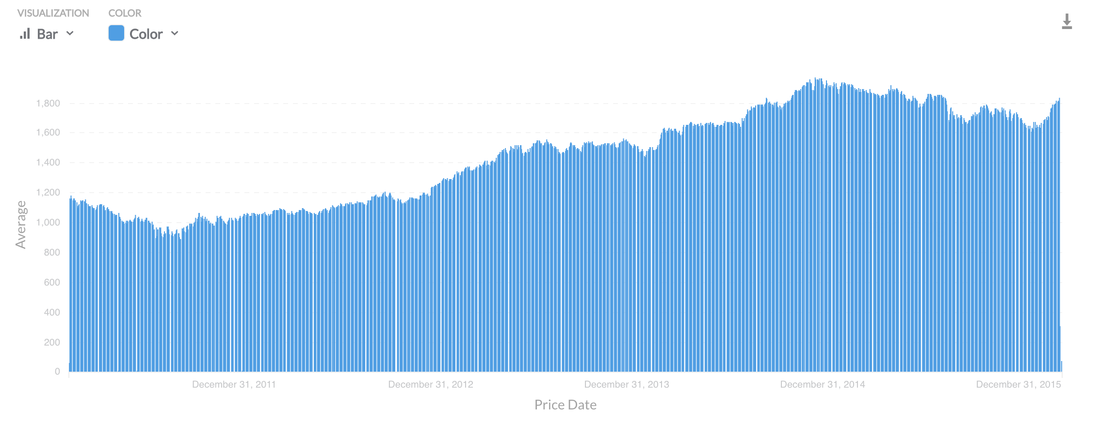
Above I'm doing a simple average aggregation of stock prices. I was super impressed on how easy it was to group by time by providing you with the options of hour, day, week etc, much faster than writing it in SQL.
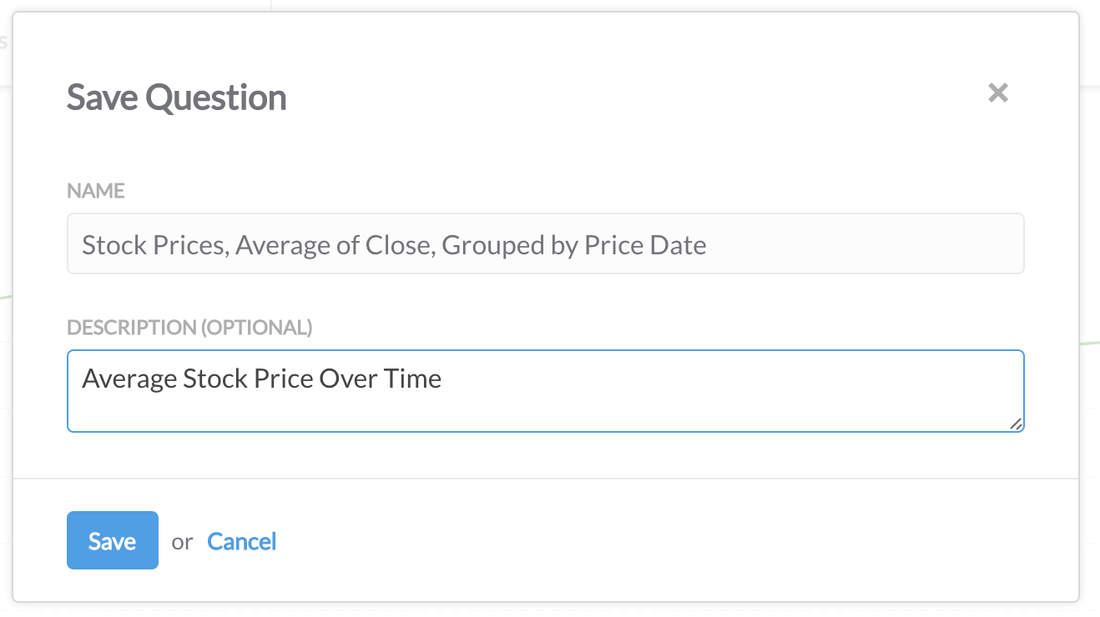
You can save each "Question" providing a useful Description.
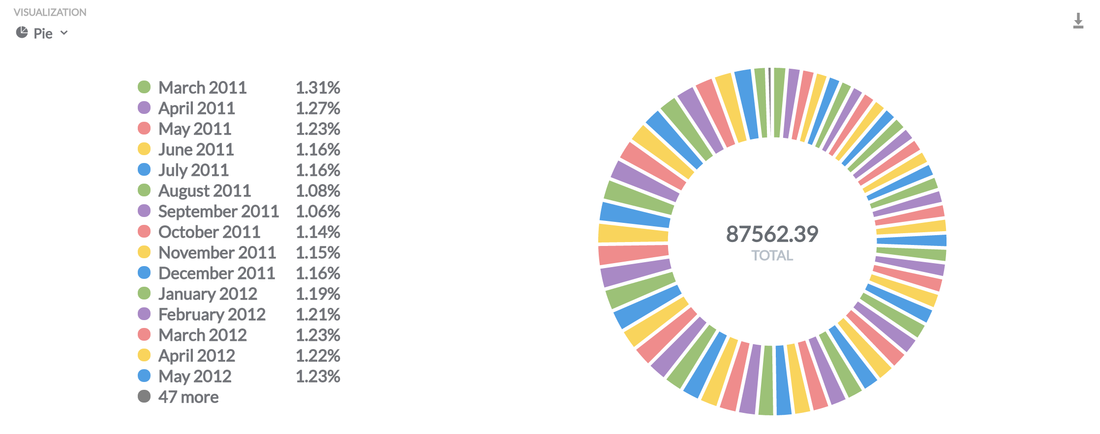
What Visualisations Are Available?: Pie, Line, Bar, Data Charts, Bar, Area and World US Maps 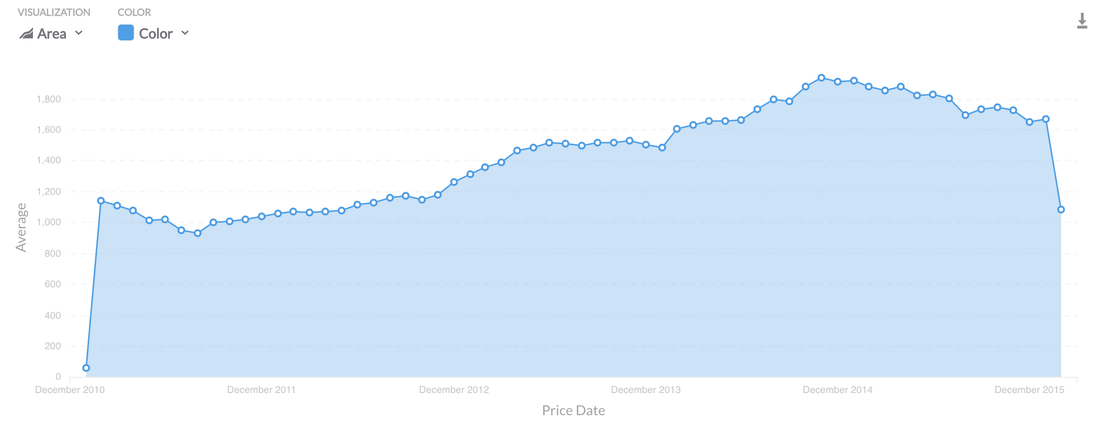
Dashboards
I saved my visualisation above and created a dashboard. To add a visualisation to a dashboard simply hit the (+) button as seen on the image below: 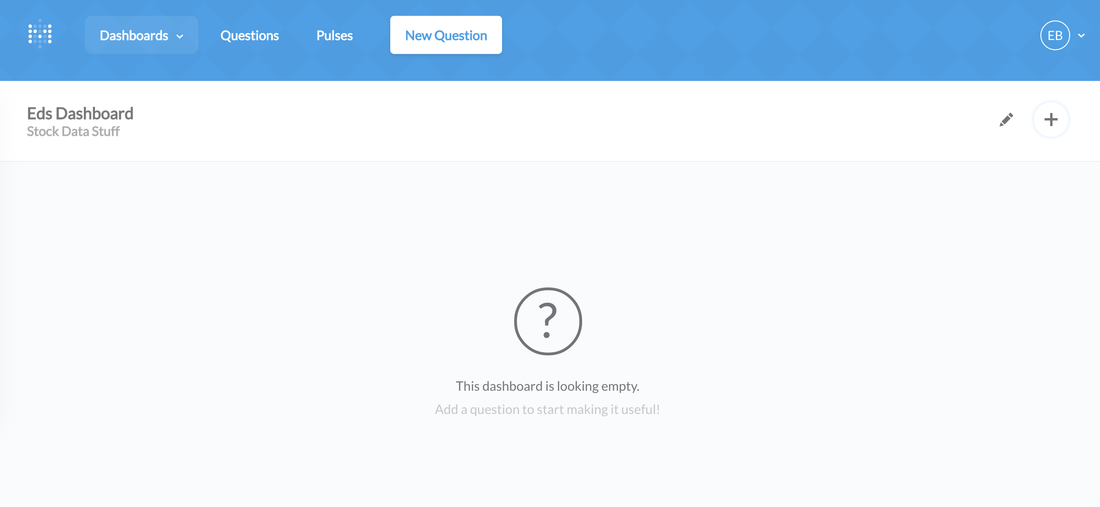
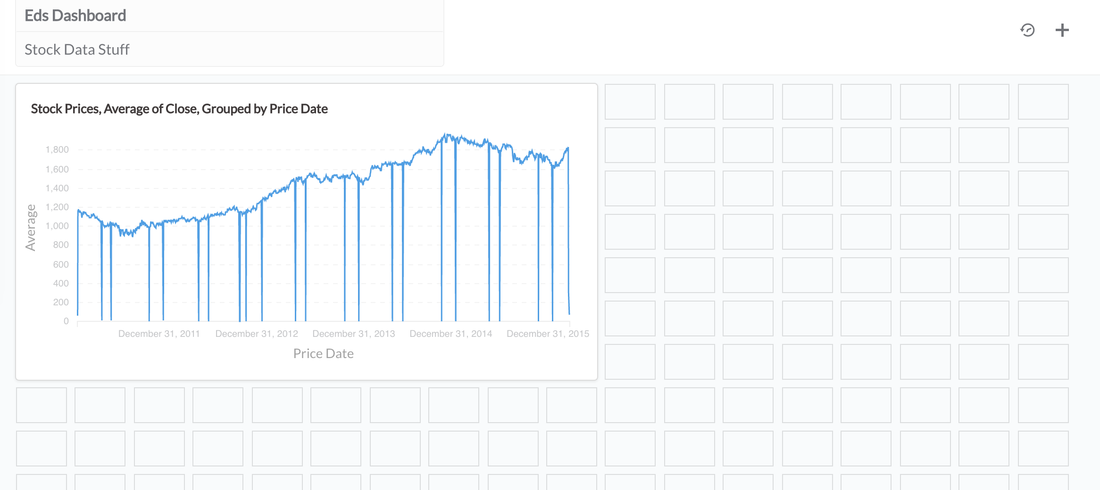
Once a visualisation is selected, you're presented with a grid like system for positioning and aesthetics. This is great to see as some graphs require more audience focus than others.
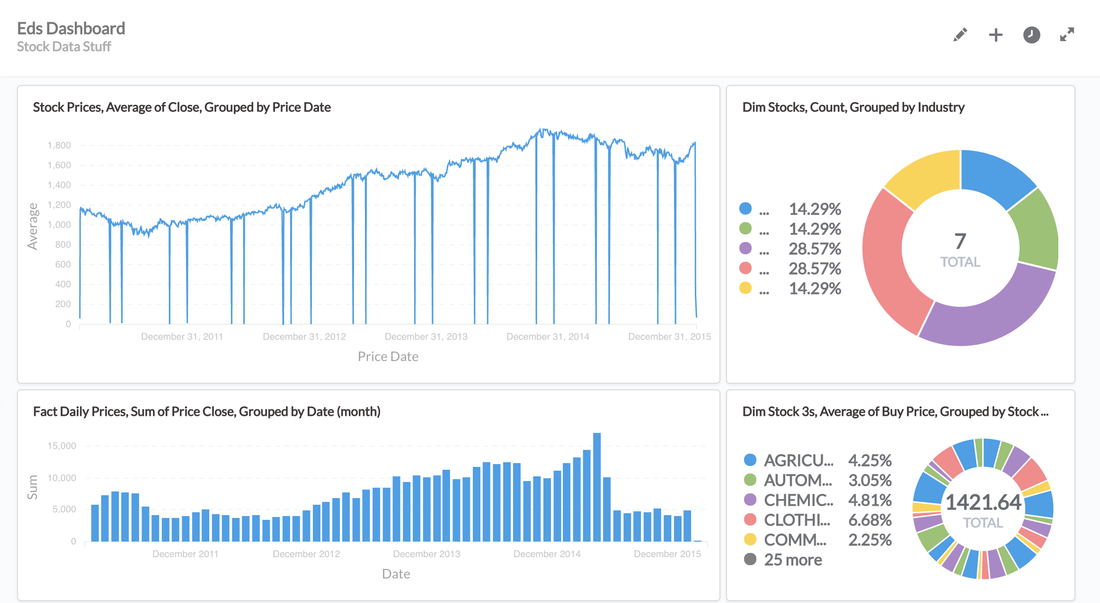
Above you can see a really quick dashboard I setup, it was completely intuitive and took me about 5 minutes to do.
PULSES Another cool feature; Pulses allow you to send data on a schedule either via email or everyones favourite messaging app "slack" 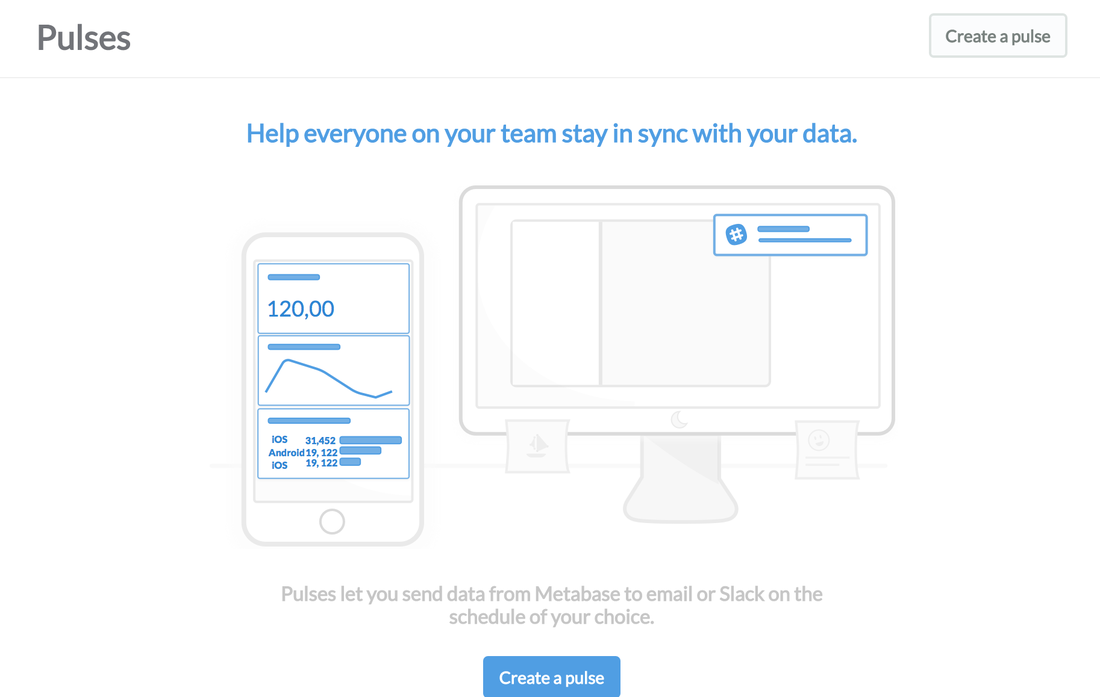
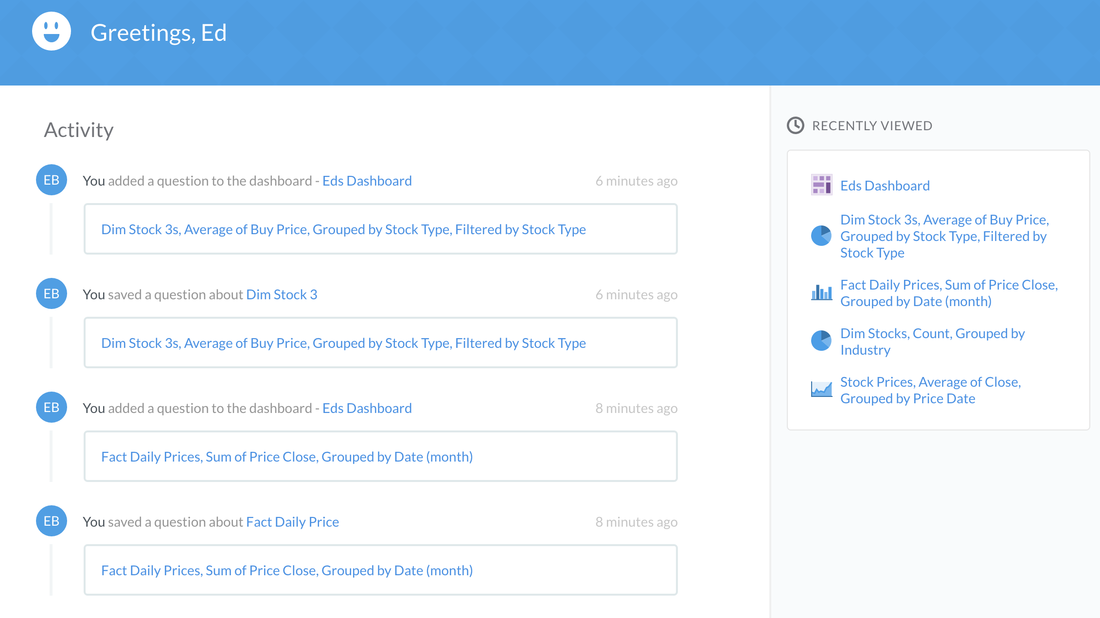
MetaBase provides you with a historical view of changes or activity in your organisation on the splash screen.
What About Power Users?
For people who are SQL experts and want to write some killer SQL Scripts: In the new 'Question" option select "Open Editor" and go crazy! 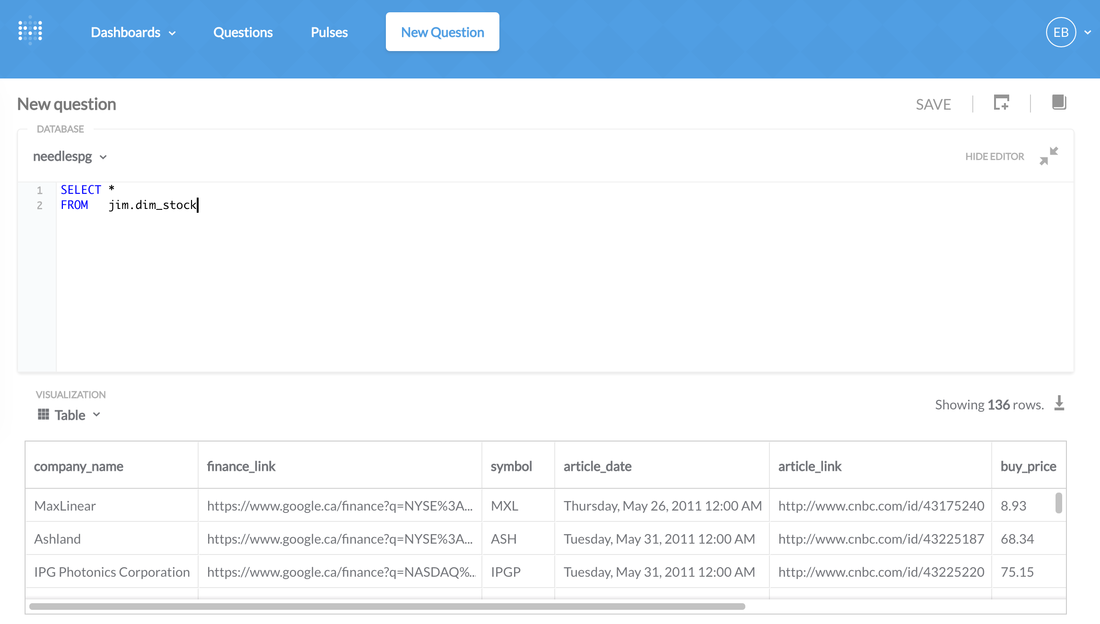
What I loved:
What I would like to see more of:
CONCLUSION This is the best open source visualisation suite I have laid my eyes on. It's extremely well thought out, it's free and is an awesome alternative to paid tools suites like Tableau or Microstrategy. This should be on every startups (people with a budget) list of technology to implement internally. 
I haven't done a review on a big data toolset for a few months, instead I have been boring you with traffic and stock data. Well fear no more! Today I review Apache Zeppelin.
It's good to note that the project is under incubation with Apache right now, which means that it's going to be a little rough around the edges. The project looks very healthy with 110 contributors on github which gives me faith that it's here for the long term. WHAT IS ZEPPELIN? Do you work in data analysis? Do you have multiple complex simple and big data environments? Do you work in a team? Do you like Sharing? This is a great platform for analysts to share, document and report data. It supports a plethora of systems and languages: Python, R, Spark, Hadoop, Postgres, ElasticSearch, JDBC, Flat Files, Ignite, Flink, Cassandra, Hbase (and I'm sure many more to come). In their words : A web-based notebook that enables interactive data analytics. You can make beautiful data-driven, interactive and collaborative documents with SQL, Scala and more. HOW TO INSTALL IT: I'm installing Zeppelin on an Ubuntu 14.04 VM host, so you may need to adjust any code snippets based on your operating system of choice. Download the package, unpack and remove tgz file. At the time of this post, the latest stable version is 0.5.6. You might want to check to see if there's a newer version if you're following my steps. wget http://www-us.apache.org/dist/incubator/zeppelin/0.5.6-incubating/zeppelin-0.5.6-incubating.tgz
There's a bunch of dependencies, make sure you have the following:
For me I had an old version of Maven, I had to uninstall the old version and run the following to get it all up to date: wget http://www.eu.apache.org/dist/maven/maven-3/3.3.3/binaries/apache-maven-3.3.3-bin.tar.gz
Configure Maven to get some more memory:
export MAVEN_OPTS="-Xmx2g -XX:MaxPermSize=1024m"
Build the package, this takes some time! (make sure you're in the zeppelin dir)
mvn clean install -DskipTests
Start it up!
bin/zeppelin-daemon.sh start
EXPLORING ZEPPELIN
In your browser, go to "192.168.1.21:8080", replace my own IP with your host IP. 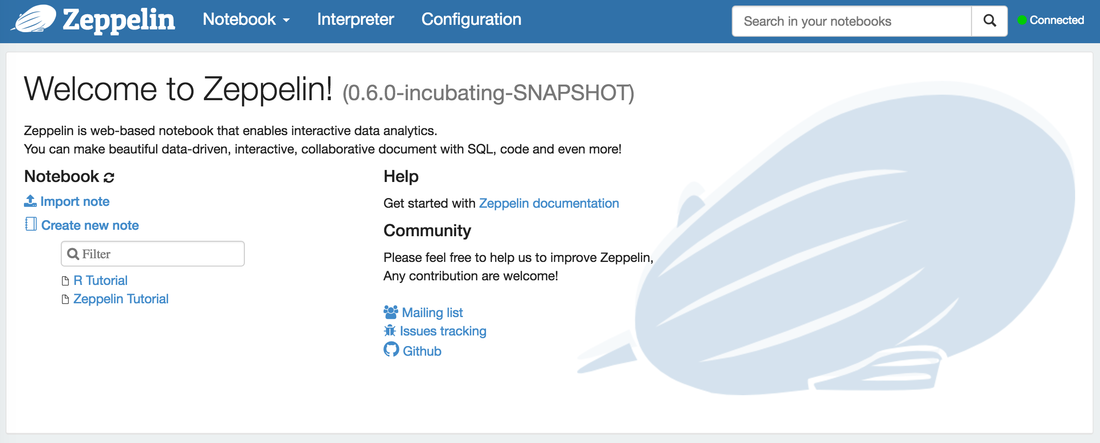
So where to from here? I have a couple of databases (postgres and mysql) setup on the same VM so we will now connect the postgres database.
In your browser, select the "Interpreter" tab and click the create button. (An interpreter is like setting up a new connection to a new environment") 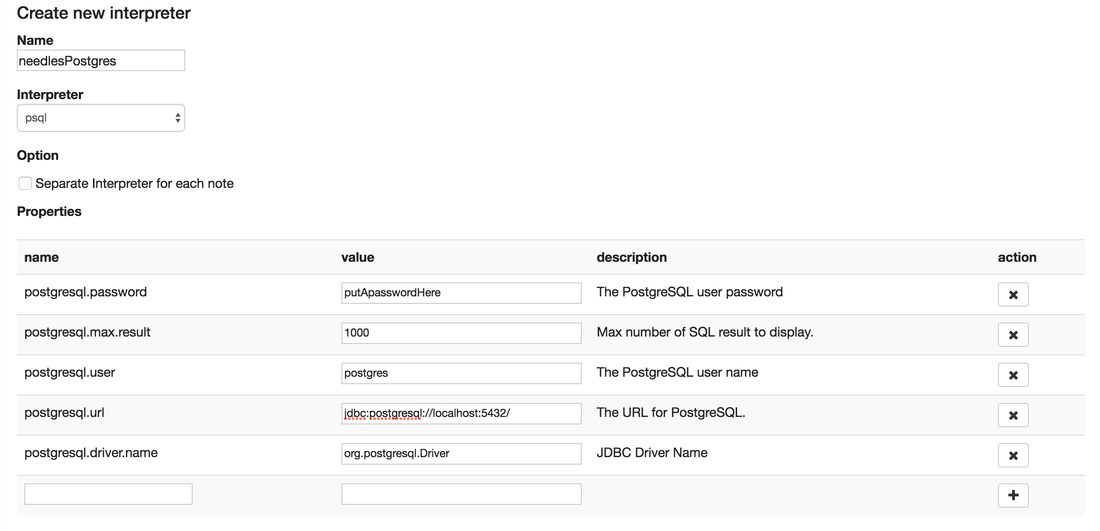
Make sure you select the correct "interpreter" in the drop down, I selected psql for postgres. Add in the usual connection details. You will see that my JDBC URL is localhost, as it's installed on the same VM. One thing I'm not too keen on is the fact is once you save the "interpreter" it's happy to show your password to the world.
One thing which took me awhile to get the connection working with Postgres was the connection URL, if you don't specify the database you're gonna have a bad time. My connection URL ending up being "jdbc:postgresql://192.168.1.21:5432/needles" RUNNING OUR FIRST QUERY: 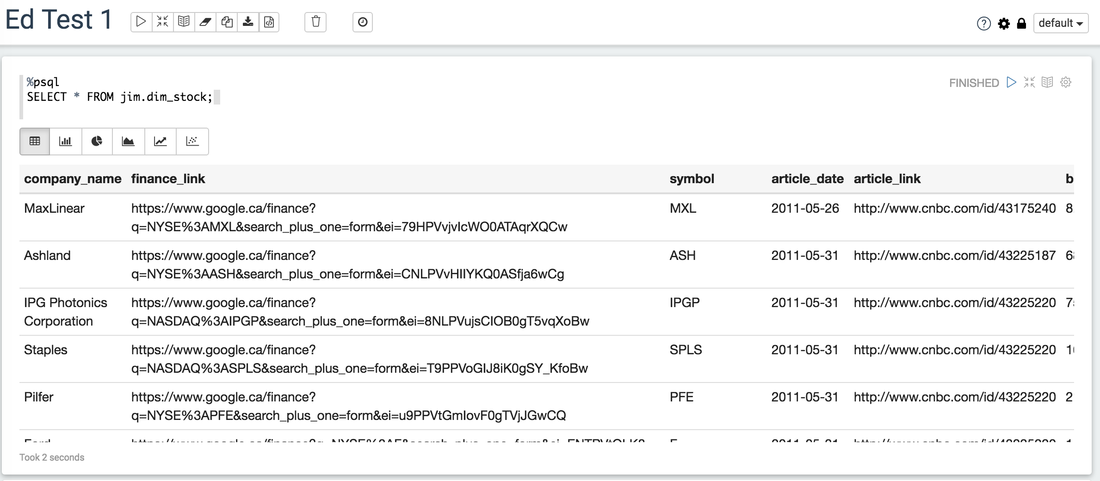
You need to specify the interpreter in the first line in my example I used %psql then my query.
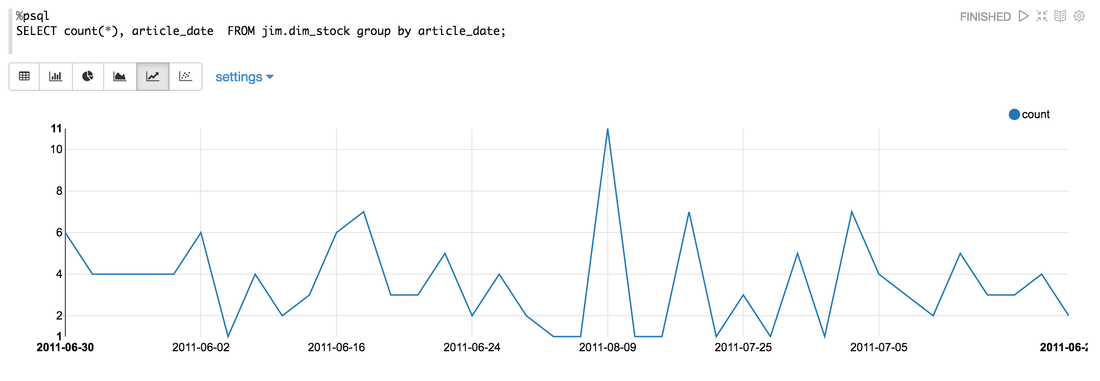
GRAPHS Below I ran a simple aggregate to try out the graphing options. 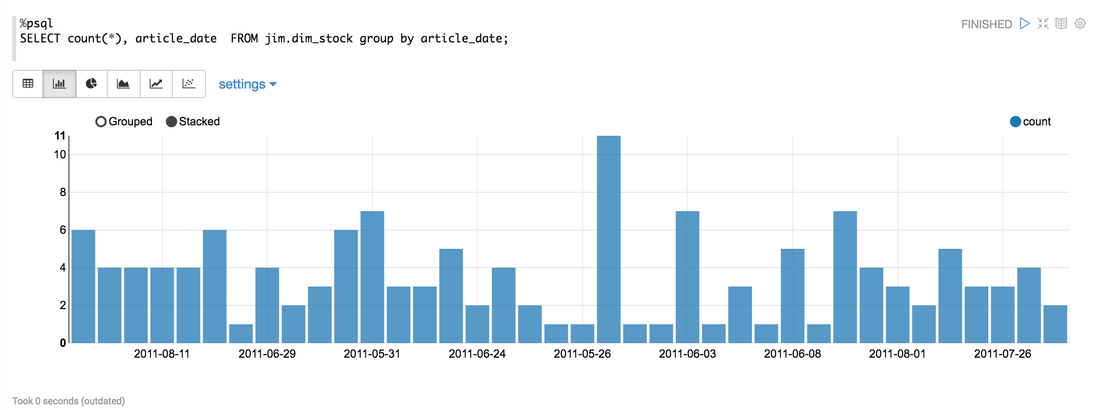
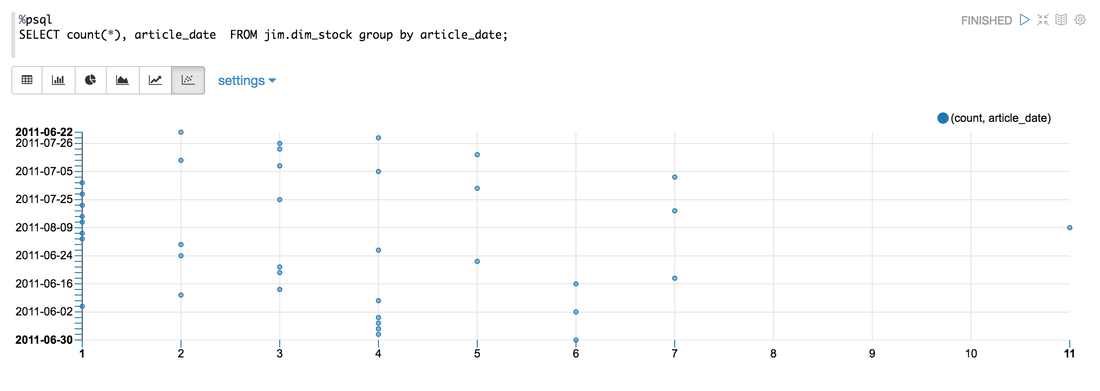
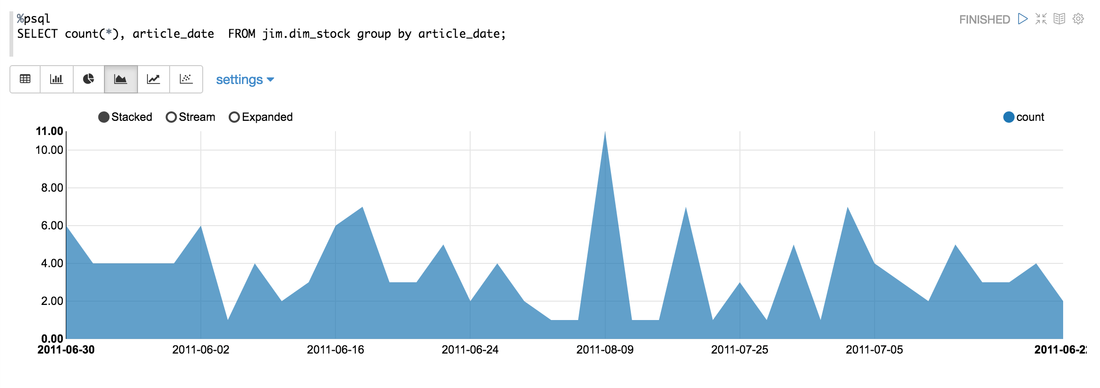
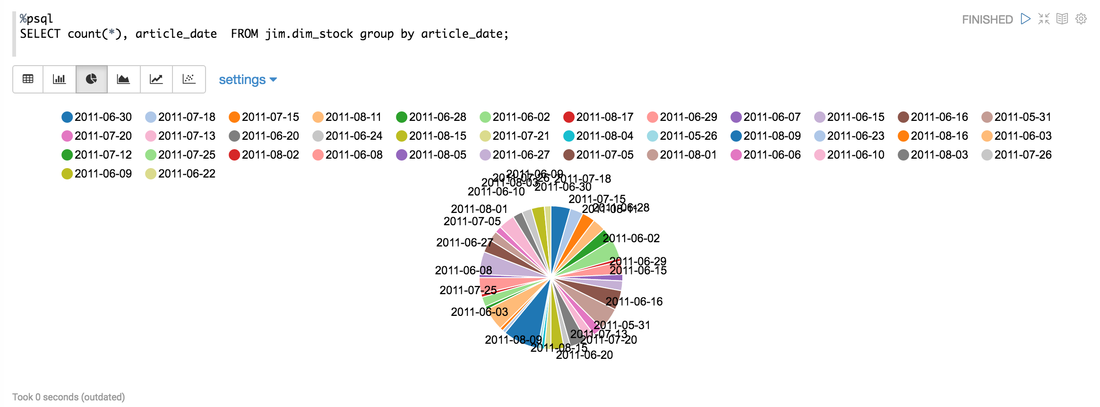
The first result I got didn't show this! Both axis were showing numerical values, and you can see from my query that I am grouping by a date. To fix this I selected the "Settings" tab, re-arranged the values and keys (similar to excel pivot charts) to reflect what I wanted. Displayed below are more graphing options using the same query:
It's important to note that each notebook at the time of the blogpost can only have one interpreter, it's a known limitation in Zeppelin.
OTHER COOL THINGS
THINGS I WOULD LOVE
CONCLUSION! This is cool! $0 cost, connects to almost everything and it's only going to get better. Analytical teams need shared platforms that enable story telling and data discovery. INTRO: I have dabbled twice in the stock market with very little success. One take away I got from my experience was that the stock market is not for the faint hearted, much like a day at the race track.. I figured that the stock market was gambling for rich people. I went in very naive and bet on companies I liked, no more analysis than that. My biggest win was a 10% increase in 24 hours and my biggest loss was 20% in 24 hours. There are loads of stock market celebrities out there, while living in Canada I frequently came across a guy on TV called "Jim Cramer", his show is called "Mad Money". On his show Jim makes the stock-market kinda fun, he bounces around the studio with what seems like a supply of endless comedic props, whilst people call him up for advice on what to buy and sell. So why am I talking about Jim? Well.. since I'm terrible of the stock market but pretty good with data, why not actually look at how successful a real stock market expert is? THE SETUP: They say most data analysis is 90% collection and preparation, that was 100% percent true in this case, but here's what I did:
Note: I'm no financial expert, I'm merely seeing if Jim has the chops! (is that a NZ saying?) THE TLDR: Summarized up, this is what I found from a high level:
THE DEEPER DIVE: It's very useful to note that some of these analyses are based on "The stupid", "The Realistic" and "The Perfect" stock-market scenarios, please..please don't think that you as an everyday person can achieve "The Perfect" based on what I'm saying (otherwise I wouldn't write this blog and keep all the information to myself!) Jims Recommended Stock Value Over Time 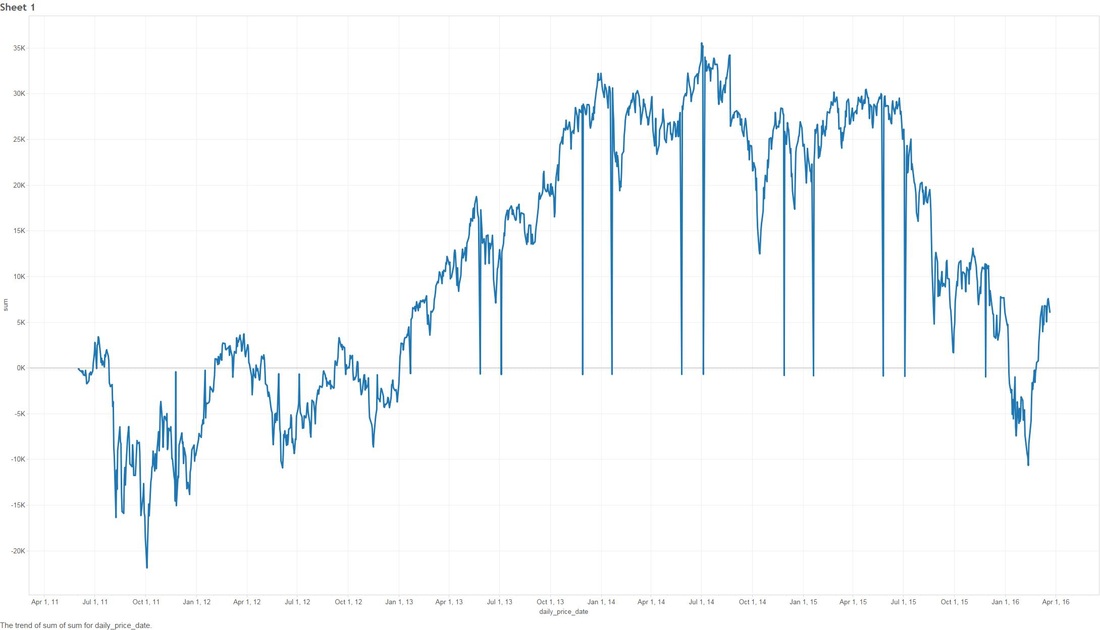 In the above scenario I have fictitiously purchased $1,000 worth of stock from each Bull (means buy) recommendation. Our highest point of earnings is the 1st of July, 2014 where our portfolio has gained ~35k in ~3 years. You might also see some points that dip to the zero line, this is where yahoo data still reports stock prices on American holidays but zeros them all out. The Perfect 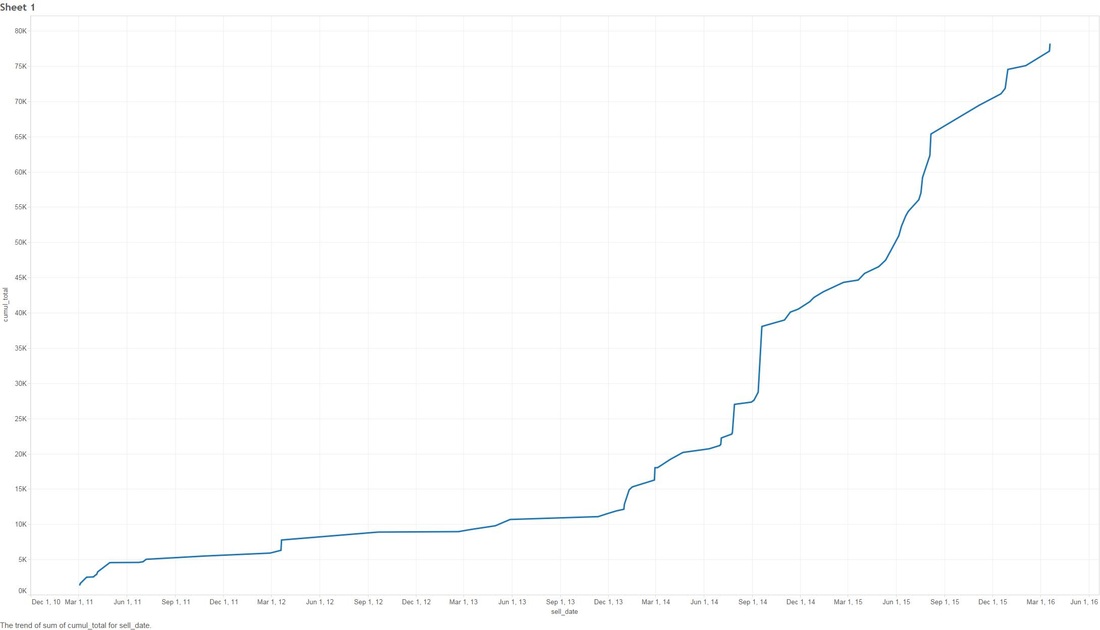 Buying $1000 worth of each recommended buy (bull), then selling them at the highest point price between 2011 and 2016. (again.. I have to point out that no one on this planet can do this). We have earned ourselves a handsome $79,138 with 2014 and 2015 showing the most gains, that's earning almost 80% over 5 years! The Realistic Sell at 10% gain (or max sell if 10% isn't met) 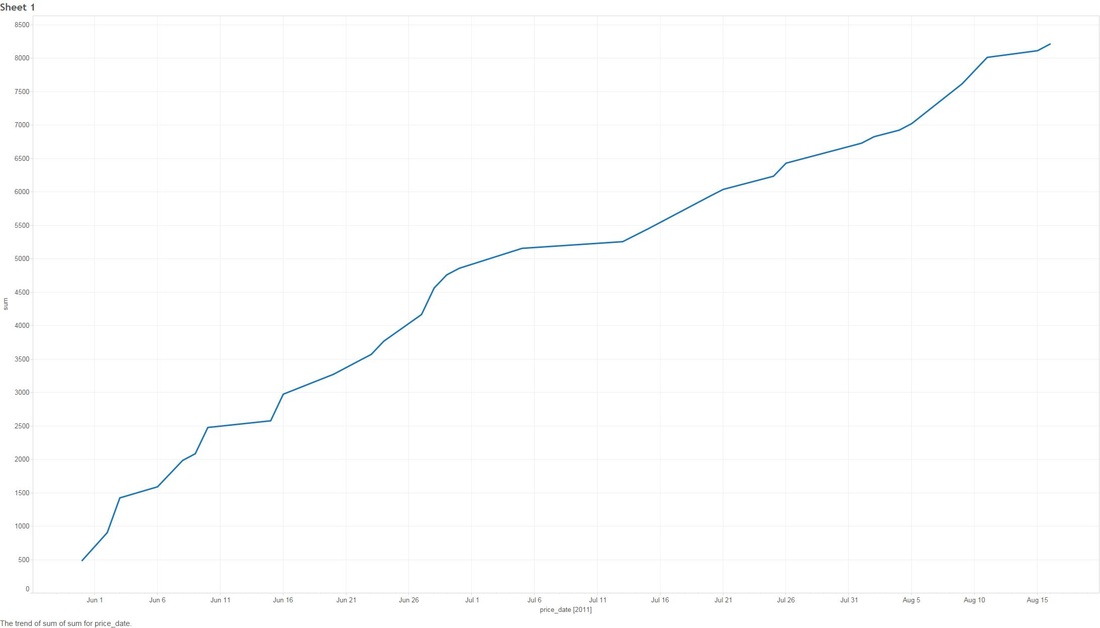 This is probably the closest to real home investors, once we reach a max gain of 10% we sell (or max sell if 10% isn't met). We made a profit of $8,210. You might be thinking that that's not much compared to the ~80% perfect sell, but the important thing to note here is we made $8,210 in around 1-3 months. Stock Industries Over Time 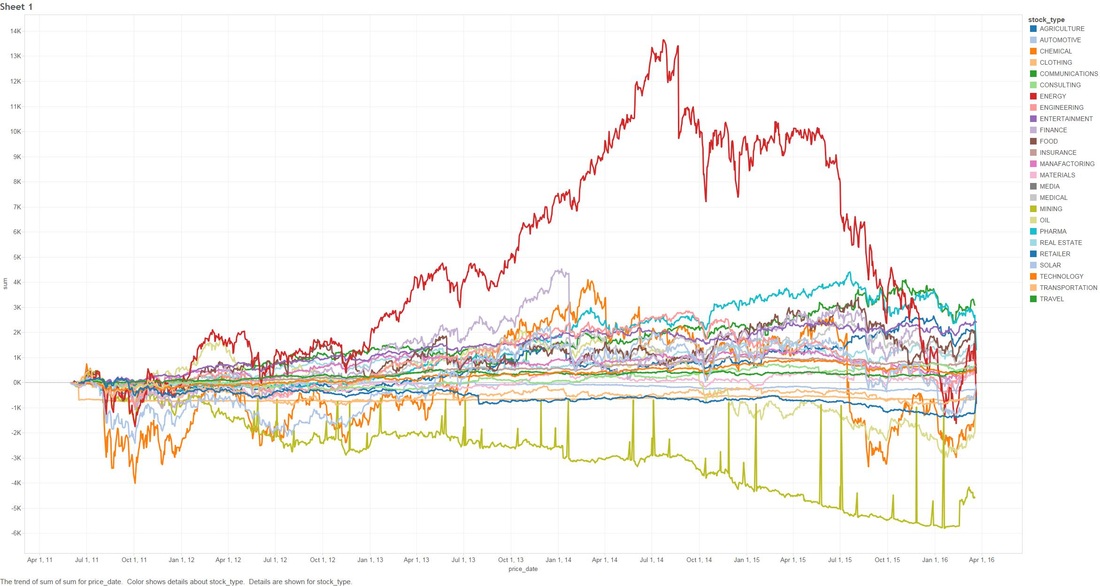 This one shows us the gains made via industry. Now before we get too far ahead of ourselves Jim Cramer may have suggested more of a particular industry which shows far more swing in a particular area. We'll clarify that below. (Remember this is the same as the very first graph, it assumes we never sell a share). Average Percent Gain By Industry 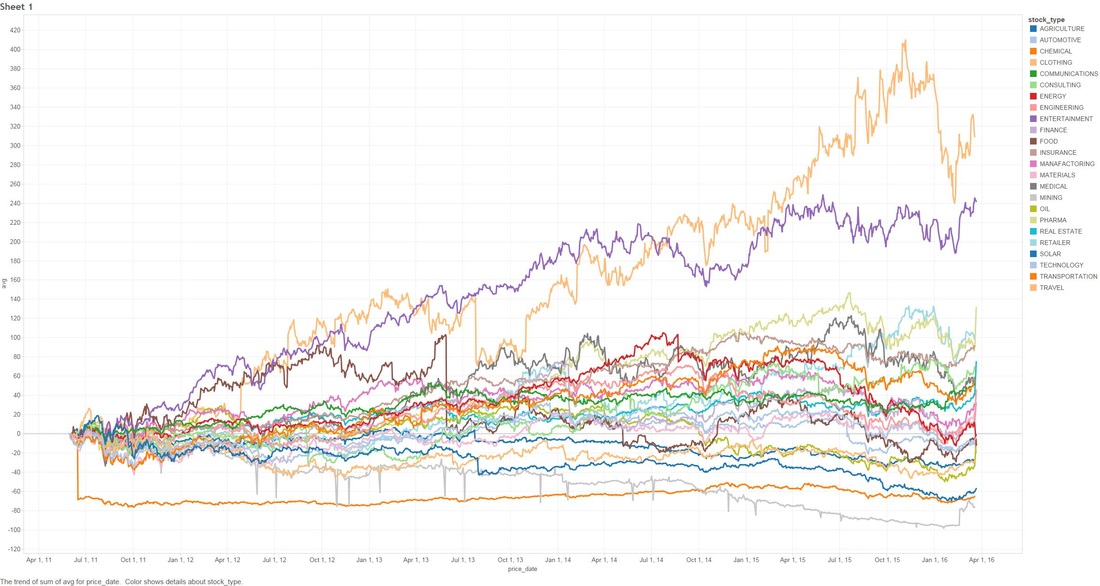 We are getting closer to what the numbers reflect here, be aware that those two heavy hitters (Entertainment and Travel) only contain 1 company in those sectors, Cramer did a great pick on them but it's not really fair to include in a "by Industry" analysis. Average Earned by Count Of Companies in Industry 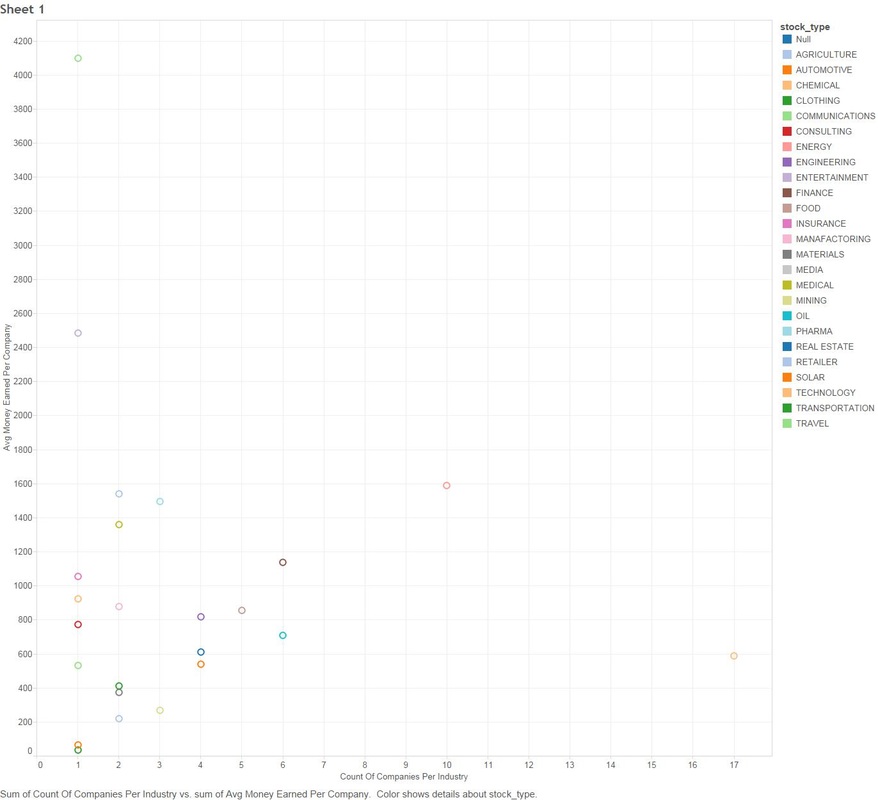 The above scenario is based on "The Perfect" sell. This graph sheds more light on what I was previously talking about above, Travel and Entertainment showing massive earning increases, but there is only 1 company in each of those categories. Jim Cramer has numerous sections in his show where he talks about diversification, violent percent swings in either direction are mainly based around the fact we have a smaller amount of companies in those industries. Segment Specials 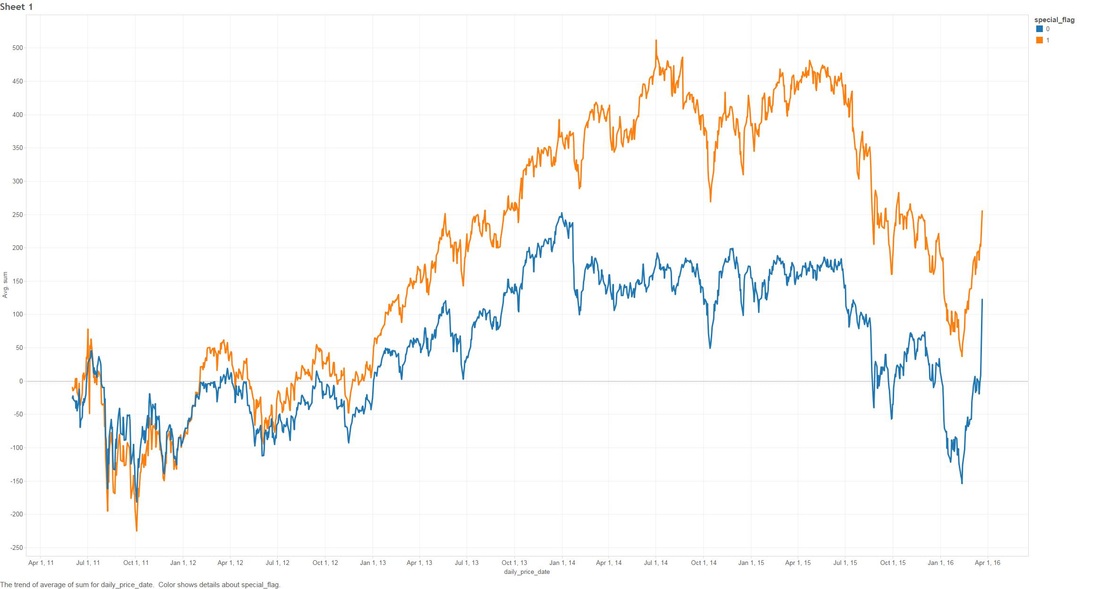 This graph shows the average sell price for a share over time split by "Specials". A recommendation with a special of 1 means it was a special and 0 was on a lightening round. A segment "Special" is one that Cramer may interview a CEO or just plain old informs us what he feels is a buy and wants to let us in on it. It's interesting to note that Jims "Specials" are really propping up the figures with non-special recommendations falling flat and lower in 2014. Compare to the S&P and DOW Below are the graphs for the S&P and the DOW over the same period. S&P 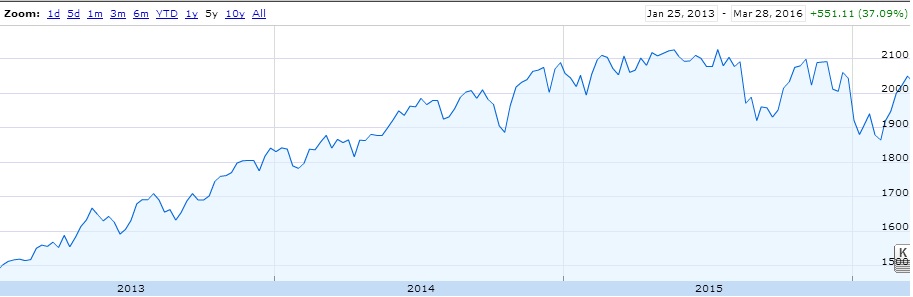 DOW 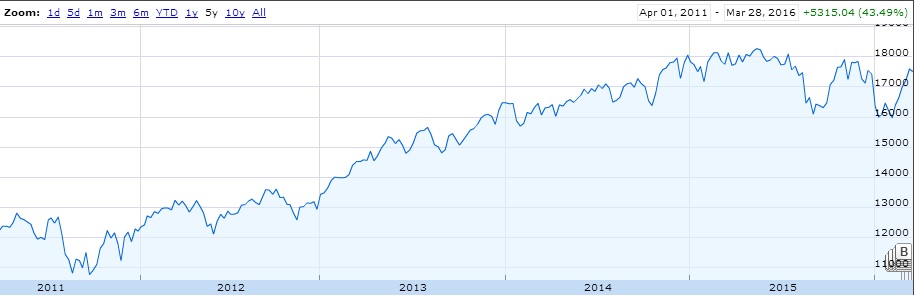 What are the S&P or DOW? To quote google:
S&P "The Standard & Poor's 500, often abbreviated as the S&P 500, or just "the S&P", is an American stock market index based on the market capitalizations of 500 large companies having common stock listed on the NYSE or NASDAQ. The S&P 500 index components and their weightings are determined by S&P Dow Jones Indices." DOW The Dow Jones Industrial Average (DJIA) is a price-weighted average of 30 significant stocks traded on the New York Stock Exchange and the Nasdaq. The DJIA was invented by Charles Dow back in 1896. Why are these relevant? Well if you have been following the stock market since 2009, there has been some massive investment, we want to make sure that what Jim is saying isn't just riding off of the coat-tails of a massive stock climb. FINISH! That's it folks! I had fun looking throughout the data, less so collecting and cleaning. I'm kinda tempted to cut more time segments for further analysis, especially since the market is in a little bit of turmoil in 2016, but there is a baby on the way and there is much to do! I'm going to cover how to implement IIS web logs into ElasticSearch via Logstash and nxlog. There are a lot of ways to do this, but in short we need to implement what's called a "log shipper" on a windows server to fire events through to logstash. I see a lot of people online using an install of logstash on each machine, I try and avoid this as logstash is quite 'heavy' in terms of system resource (I have seen many cases where it uses up to 4gb of memory just to send logs). I'm going be using the following versions of Elastic stuff for this post:
Setting up Nxlog First you need to go ahead and download the executable from nxlogs website. The community edition will be all that you need. Nxlog installs in "C:\Program Files (x86)\nxlog" by default. There are two folders that you will become familiar with:
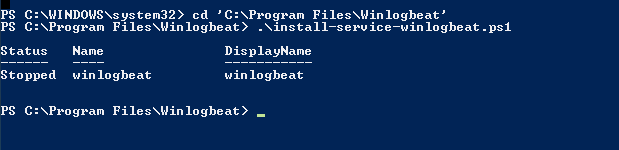
In the conf directory, backup the conf file by copy and pasting, rename to something like "nxlog_backup". In the original conf file remove any default log confs and add the following lines for IIS: <Input iis_1> Module im_file File "C:\inetpub\logs\LogFiles\W3SVC1\u_ex*.log" ReadFromLast False SavePos False Exec if $raw_event =~ /^#/ drop(); </Input> <Output out_iis> Module om_tcp Host put.logstash.ip.address.here Port 3516 OutputType LineBased </Output> <Route 1> Path iis_1 => out_iis </Route> Two bits in BOLD need to be altered: "File" needs to be the location of where IIS is throwing logs to, and "Host" needs to be the IP address of your logstash server. We're not quite ready to start nxlog yet, but that's the windows side mainly done (fairly easy huh). Setup a Config in Logstash Below is my config for logstash, you will notice the GROK pattern is based on how IIS has configured the logs (we will get onto that soon) ##### LOGSTASH CONFIG ##### input { tcp { type => "iis" port => 3516 host => "your.logstash.host.ip.here" } } filter { if [type] == "iis" { grok { match => {"message" => "%{TIMESTAMP_ISO8601:timeofevent} %{IPORHOST:hostip} %{WORD:method} %{URIPATH:page} %{NOTSPACE:query} %{NUMBER:port} %{NOTSPACE:username} %{IPORHOST:clientip} %{NOTSPACE:useragent} %{NUMBER:status} %{NUMBER:response} %{NUMBER:win32status} %{NUMBER:timetaken}"} } } } output { elasticsearch { user => "user" password => "password" hosts => ["elastic.node.1","elastic.node.2","elastic.node.3"] index => "iis" document_type => "main" } } A few things you're going to need to alter: Change the logstash.host.ip.here with your logstash host ip. You also may notice that I have a user and password in my output section, that's because I have shield enabled on the cluster, if you don't use shield just remove those entries. Another important thing to note is the GROK pattern I'm using, if you copy and paste my example you might have a bad time due to your configuration of logstash having more or less log attributes. You can find out your IIS log config by going into your windows server, opening "Internet Information Services" and select the "logging" icon. 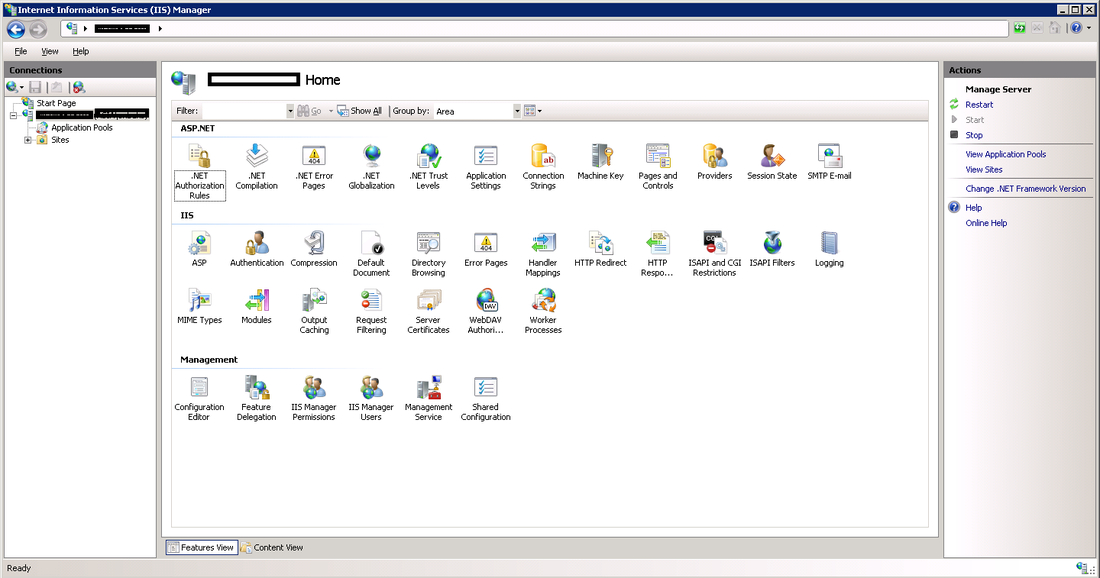 Once you have selected the logging option, click the "Select Fields" button, this shows us what IIS has configured for web-server logs. 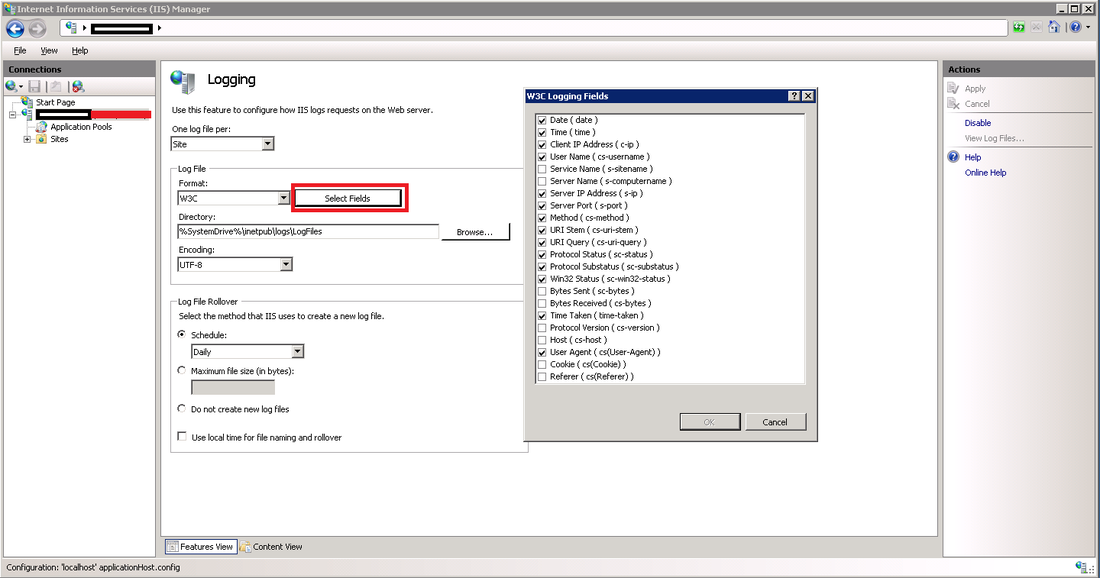 Alternatively you can see the order and fields included in each log file at the top of each IIS log. Check the screen shot below. 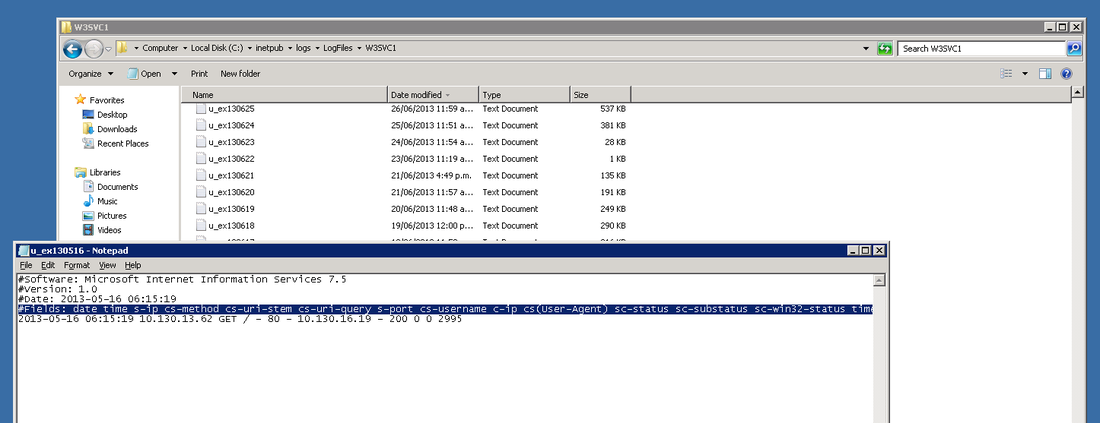 ELASTIC SEARCH INDEX N STUFF Before you fire up logstash, you will need to have an index to write to, first you need to create the index, in my case I have called it "iis": curl -XPUT 'http://your.elastic.server.ip:9200/iis/' I have created a fairly simplistic mapping to go with our index: curl -XPUT 'http://your.ip.address:9200/iis/_mapping/main' -d ' { "main": { "properties": { "timeofevent": {"type": "date", "format": "yyyy-MM-dd HH:mm:ss"}, "hostip": {"type": "string","index" : "not_analyzed"}, "method": {"type": "string","index" : "not_analyzed"}, "page": {"type": "string","index" : "not_analyzed"}, "query": {"type": "string","index" : "not_analyzed"}, "port": {"type": "integer"}, "username": {"type": "string","index" : "not_analyzed"}, "clientip": {"type": "string","index" : "not_analyzed"}, "useragent": {"type": "string","index" : "not_analyzed"}, "status": {"type": "integer"}, "response": {"type": "integer"}, "win32status": {"type": "integer"}, "timetaken": {"type": "integer"} } } }' FIRE IT UP! LOGSTASH Before you fire up logstash, test your newly created config file by running the following command: sudo /etc/init.d/logstash configtest If all passes, you can start up logstash by running: sudo /etc/init.d/logstash start Remember, if things start to go awol, you can check the logs for logstash by running the following command: sudo tail /var/log/logstash/logstash.log NXLOG You can startup nxlog through powershell or through the services manager. 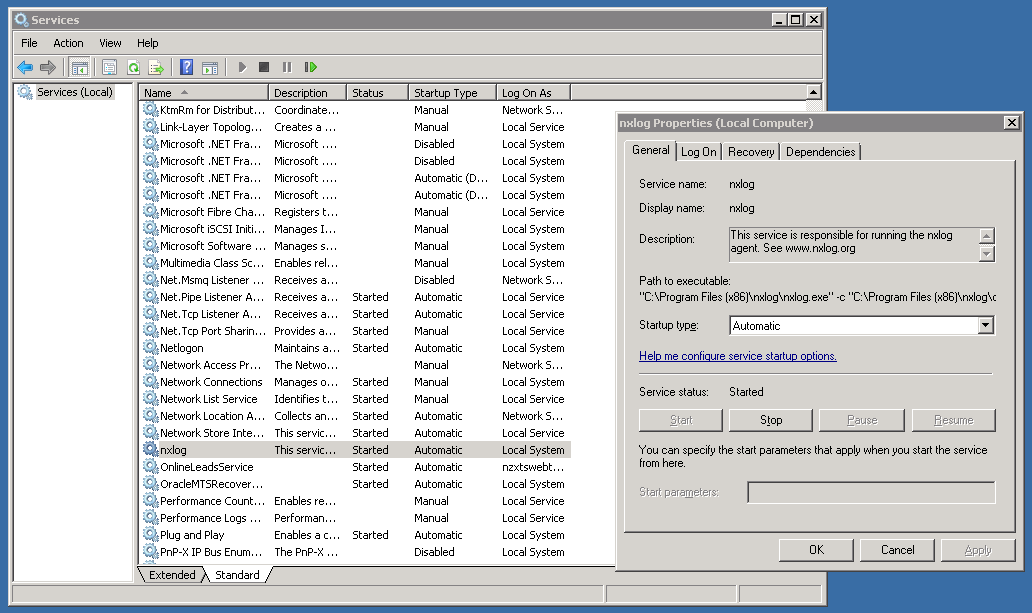 See if everything is working by checking the size of our index in Elastic by running: curl 'your.elastic.ip.address:9200/_cat/indices?v' 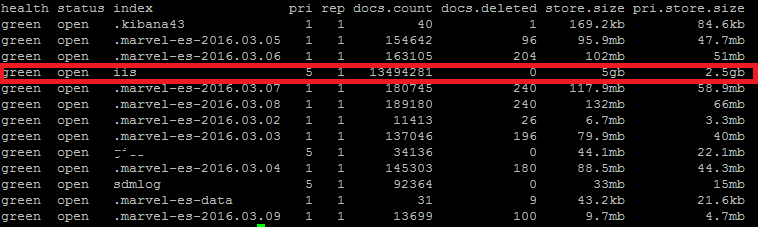 That's it folks: If you're using Kibana you can make a real pretty dashboard to display what's happening in real time on your web-server (here's one below I made in about 20 minutes): 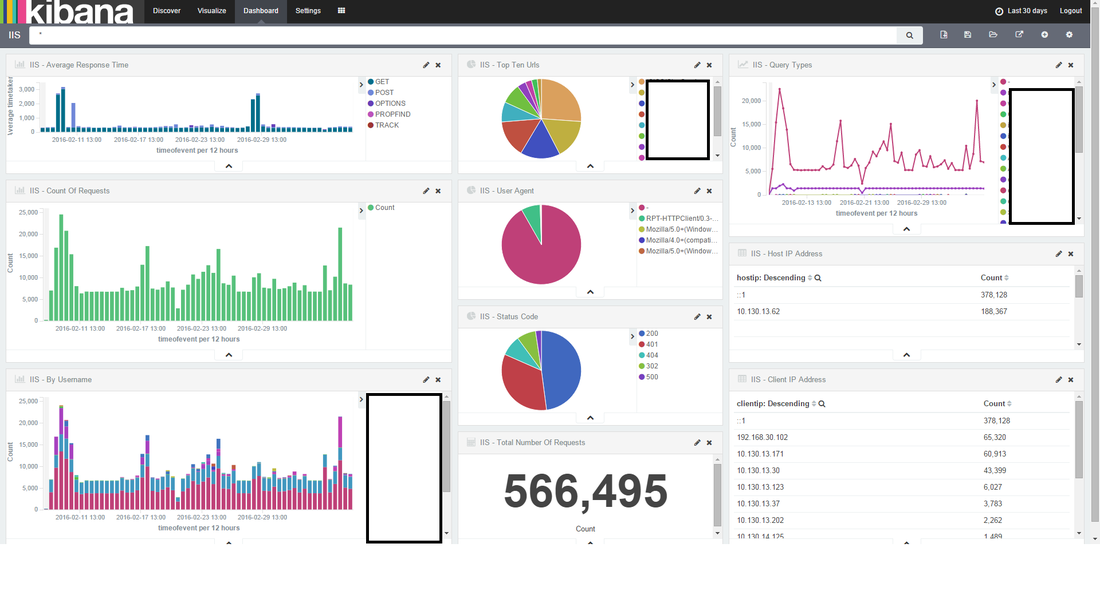 Yes, even Windows needs love... I understand that most startups or cool kids use linux, but there are a heck of a lot of businesses that run IIS / C# / SQL Server to get things done. I must admit I have previously setup logstash monitoring on Centos and Ubuntu and it's pretty easy... so easy that I don't need to write about it. Installing logstash on every server to collect and send logs through to elastic can cause a bunch of unnecessary overhead. You might come across the term "logstash shipper", which effectively sends logs to a centralized logstash server, so... that's what we plan to do, or better yet skip logstash and go straight to Elastic. There are 5 millions ways to skin a cat (send logs to Elastic), but I'm going to go straight Elastics direct offerings and have a play around with Beats and winlogbeat, not to be confused with the overly expensive headphones by Dr Dre that sound like poop and only 16 year olds and recruiters wear. #1 DOWNLOAD https://www.elastic.co/downloads/beats/winlogbeat Some reference install documentation https://www.elastic.co/guide/en/beats/winlogbeat/current/index.html #2 INSTALLING I'm going to be the first to admit it, I don't know what powershell is (I have been too linuxed for too long). Google tells me: 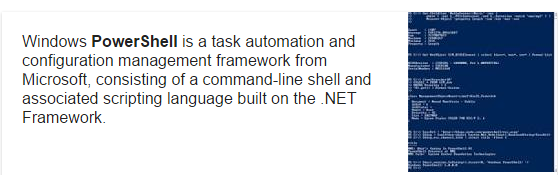 Alright, now all the windows fan boys can scoff at my lack of knowledge of powershell (I'm actually MCP certified for Win server 2003, but that was over a decade ago):
 #3 CONFIGURATION So it seems to me that the service is now installed. Before we kick this thing off we need to configure some stuff, eg: like where to send all of the glorious logs. (I'm assuming you already have an elastic instance running some where). Most of your configuration for your server is located in "C:\Program Files\winlogbeat\winlogbeat.yml".. if you don't know what YAML is, it stands for "yet another markup language" which is slightly confusing as it's more data oriented than markup. Let's move on.. The great thing about the config YAML file is that the developers at Elastic have thankfully made some very clear comments in the file, so it shouldn't be too easy to screw up. 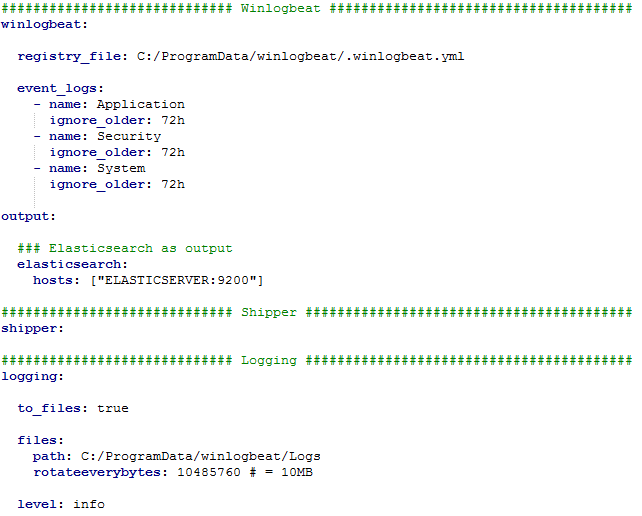 I cut all the comments out of the winlogbeat.yml file so it was easier to make sense of for this blog. Below is a small explanation for each section:
Now to figure out what "event_logs" are available to you, in power shell run "Get-EventLog *" this will return a list of what can be gathered from this server, see below (I'm running this on my win 7 desktop initially): 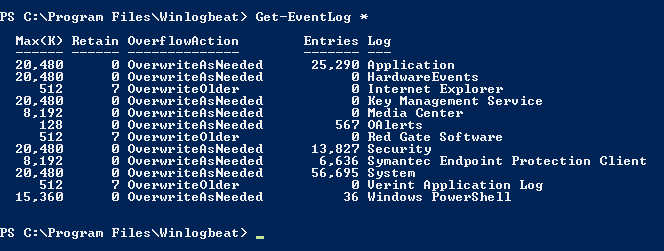 Pro-tip: Before you save your own config file, make a backup of the old one. If you're not used to YAML, chances are you'll format something wrong. Try www.yamllint.com to validate your formatting. If you're happy with the config file, save it! #4 CREATE INDEX AND MAPPING IN ELASTIC In Elastics documentation they ask me to run the following command in power shell (replacing the localhost section with your hostname: PS C:\Program Files\Winlogbeat> Invoke-WebRequest -Method Put -InFile winlogbeat.template.json -Uri http://localhost:9200/_template/winlogbeat?pretty I get the following error: 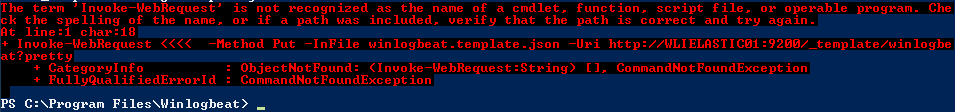 When I look at the file winlogbeat.template.json it's a standard mapping file. If you want more information to fix this then check out this article: https://matt40k.uk/2014/07/the-term-invoke-webrequest-is-not-recognized/ . I will just grab the winlogbeat.template.json file and run it a linux terminal (the same way I created all my other mappings) to get passed the errors above. (insert lazyness here). 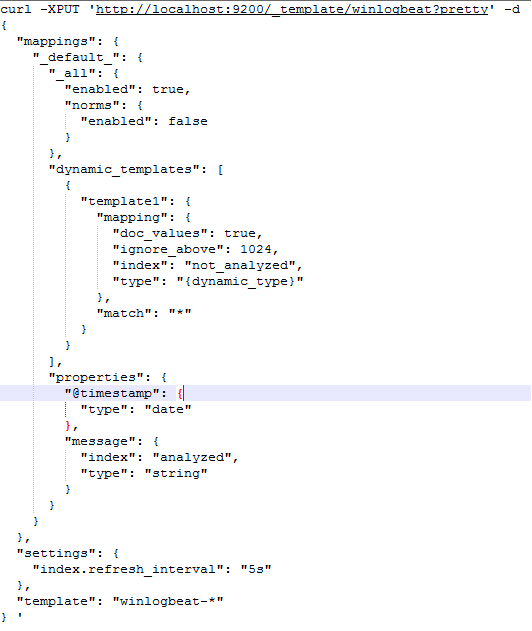 #5 START WINLOGBEAT SERVICE In powershell, startup winlogbeat by running: "Start-Service winlogbeat". You can see in my screenshots below that winlogbeat has started and collecting files. 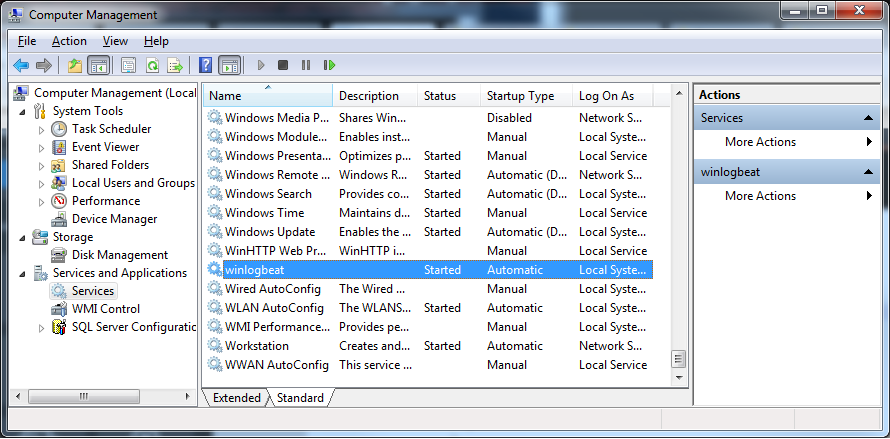 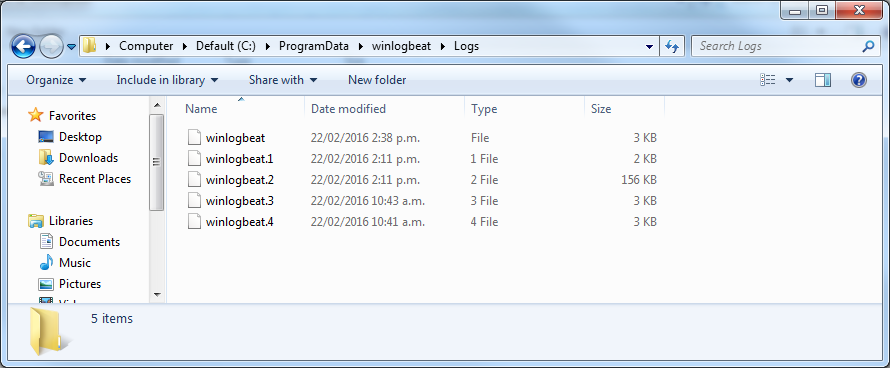 I added a new index-pattern in kibana called "winlogbeat-*" and as you can see below it has started ingesting data. 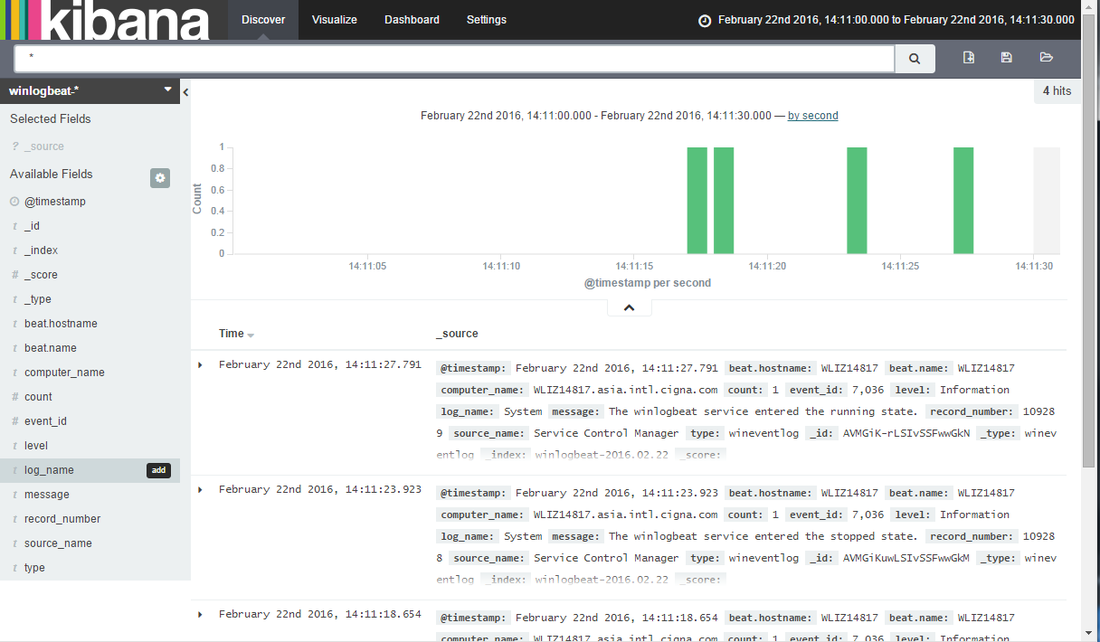 #6 FINISHING UP
A couple of notes to tidy up.
Over a year ago I moved from Canada back to New Zealand. My wife didn't want to directly live in Wellington due to the weather being sub-par, so we moved up the coast to a small town called Raumati. Unfortunately for me there isn't a lot of data work in Raumati, so I commute into Wellington 3 days a week to help out my clients. On the weekend you can travel this stretch of road in around 40-50 minutes, in 2015 during peak traffic I was averaging 60-70 minutes, 2016 struck and some days I'm up to 120 minutes. Now there have a been a lot of road works on my journey that started in 2016 and it's easy to blame the NZ traffic authority, but I have another hypothesis (that isn't ground breaking) but I think it's due to the petrol prices being so low. The New Zealand government is pretty open with its data, so I started to collect traffic stats on State highway 1 (SH1) and historical petrol prices to see if there is a co-relation between the two. So to stop my babbling, I will share my findings: 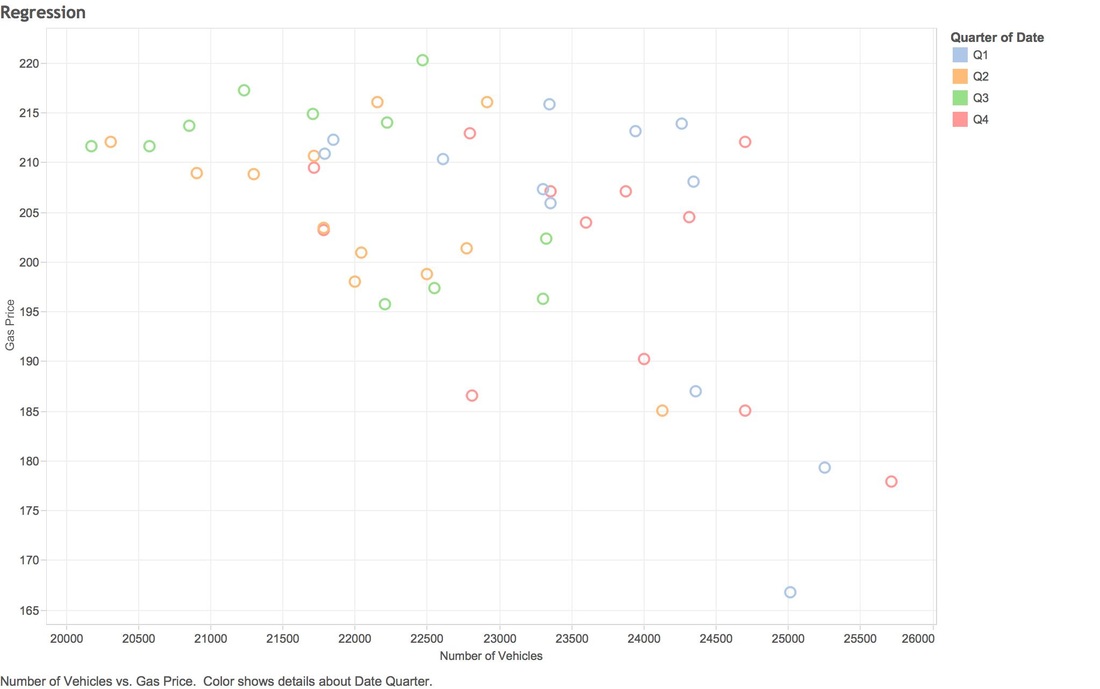 The data you're looking covers 2012 through to 2015 (4 years). NZTA hasn't provided data for 2016 yet. The Y Axis represents the cost of gas & X covers the amount of vehicles. NZTA provided data based on many points on SH1, I used the collection from Pukerua bay as that's pretty close to my place. 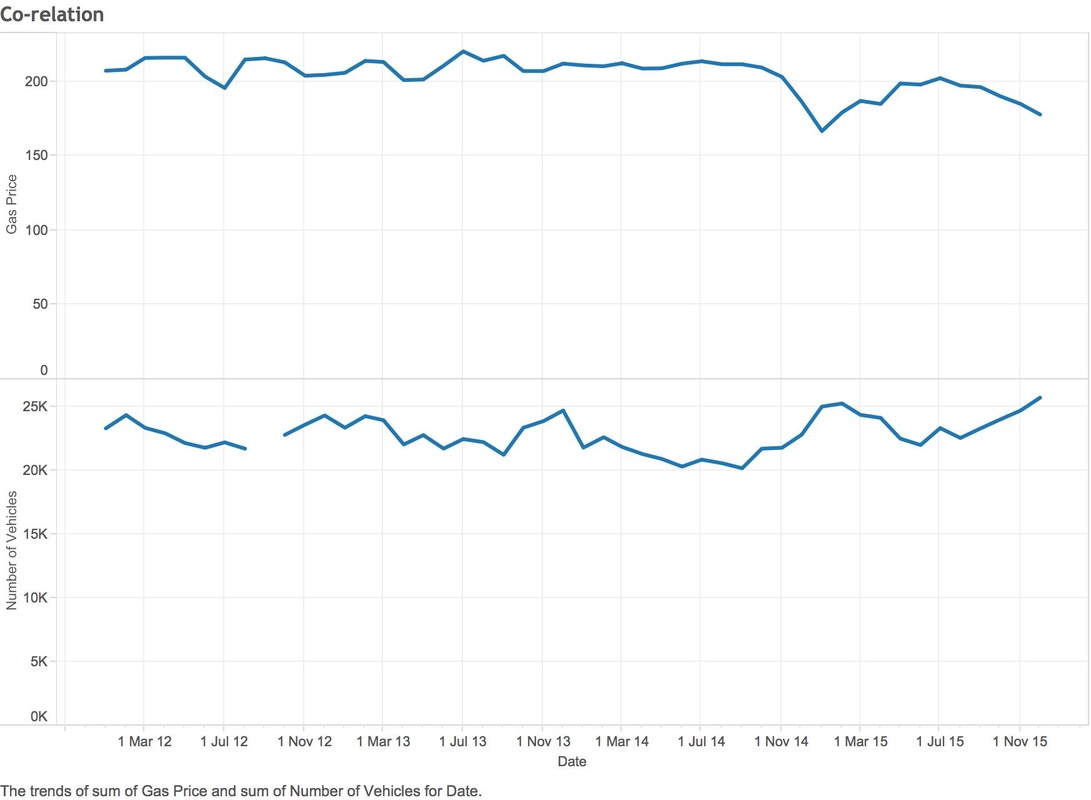 Using the same data (2012-2015), you can see a much stronger co-relation between gas prices and number of vehicles on the road (graph below). Since I don't have vehicle data for 2016, I can only make assumptions on the volumes, you can see that we are still quite a few cents down from December 2015. 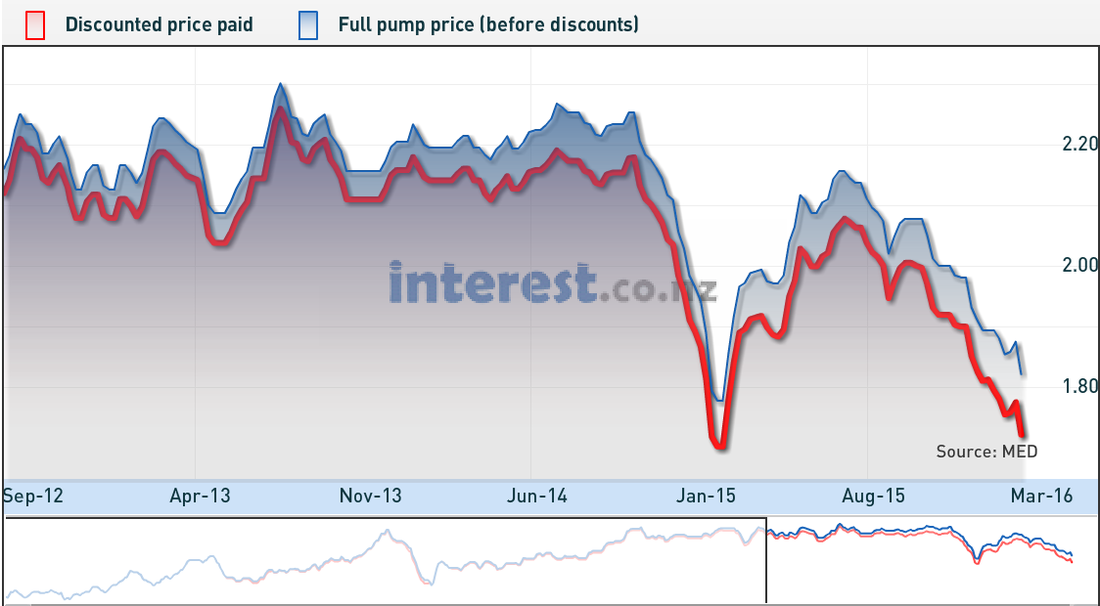 So what drives people to drop public transport and take the petrol powered horse and carriage? I drive a honda fit to work (don't laugh) and it averages around 14km per litre (which is pretty good). My total costs for driving into work 5 days a week is:
I will let you come to your on conclusions on the analysis, I feel like my original hypothesis is correct and more people are driving in based on the price of fuel. Personally I value time more than money and losing 2 hours a day isn't worth it which is causing me to get pretty close to getting that train pass. Side note: It's also valid to point out the December has the highest traffic numbers of any month for every year (christmas and holidays etc). If you're hell bent on driving into work, you might want to pray that gas prices go back up.. otherwise suck it up. Data Sources: Train costs Vehicle Data Petrol Data
8th-9th June
I have been busy creating the entity relationships, you can see a screen shot of the data for Destiny Activities and the associated relationships. You can see already it's not very clean, two entries for the same activity (inherited from the dubious website I ripped it from). 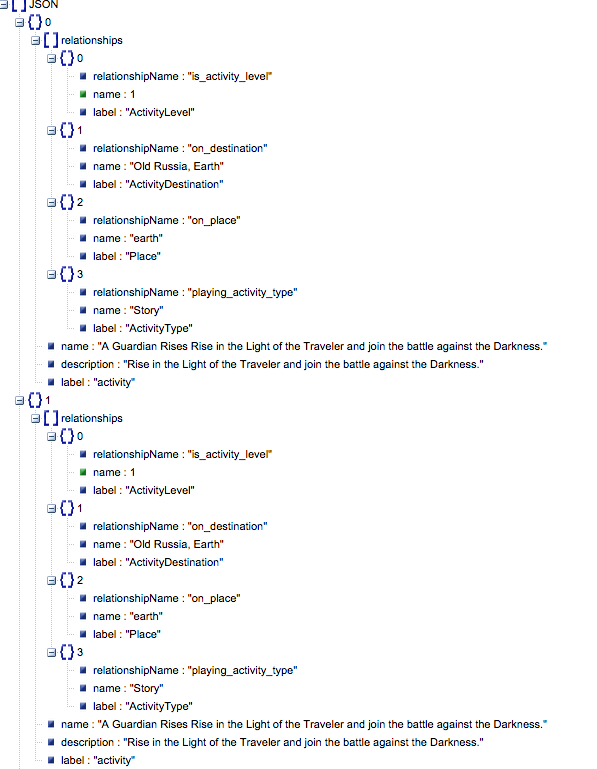
Another way ensure we only have unique entity nodes is to issue a statement in Neo4j like so:
"CREATE CONSTRAINT ON (activity:Activity) ASSERT activity.isbn IS UNIQUE;" If you try and create the same node, Neo4J will issue you something back like this: "Neo.ClientError.Schema.ConstraintViolation" I am also tackling these duplicate entries by writing each entry into a hashset and if it doesn't exist, write it to a JSON Array: if (!hs.contains(finalNodes.toString())) {
12th June
I finished off the entity JSON create scripts and now I'm working back on what I call the NEO4J utils library and it's going really well! I built a class with a couple of functions which create nodes and relationships (using the restful APIs), tested it end to end to ensure it all worked, as you can see below it's only two nodes but it's great to see it working: 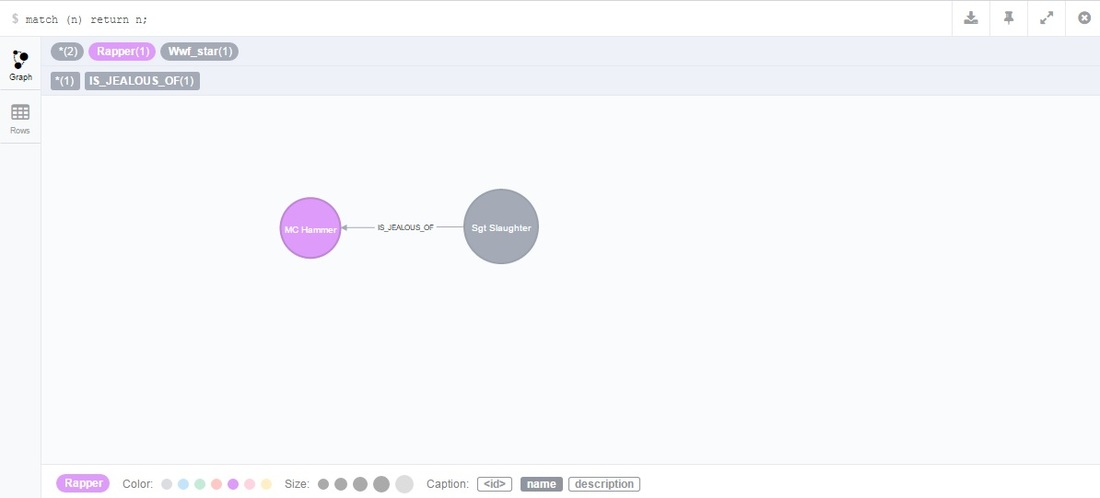
More progress: Things are starting to get exciting, I just did a test load of all the medal entities, you can see below I haven't added the relationships but in an hour (probably a day) or so I plan to have that running.
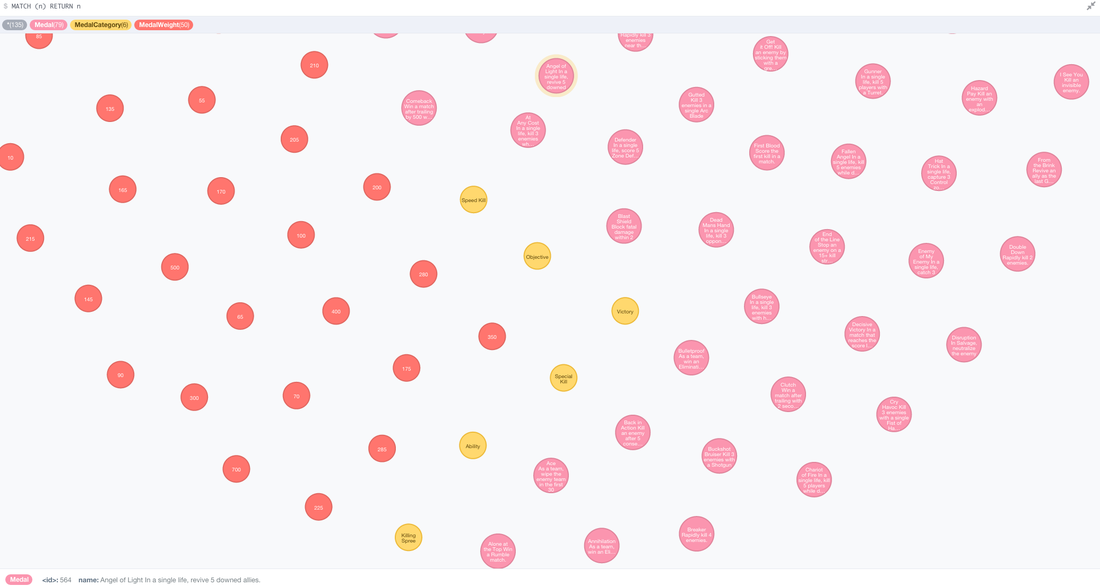
Some time later: I made some pretty good progress with the entities and the relationships, after 2 weeks of automating I have the Destiny medals and their relationships all stored in NEO4J. Below you can see a video where I did a "MATCH ALL" type query to see all my hard work in action!
What you're seeing: "Medals" in pink, "Medal Types" in yellow and "Medal Weight" in red. All the lines joining the nodes are relationships
It's fair to say I'm getting pretty amped about this, I need to spend some time mapping out what's next, I'm assuming that I'm going to be stepping into document classification using Reddit posts.
Go to my next post
It's been a weird week. I resigned from Vend, I have no bathroom (renovation) and it's pretty cold. Enough about my sob stories!
In my last post in this series I was talking about the API ingestion, thinking about how stupid I was to have multiple calls for different attributes / relationships on a single node. Well, as I have mentioned before this is my first time with Neo4j for some reason I skipped over the very first part of the Java API example which shows you how to use the Cypher language in an API call. So erase most of my last post from your memory. So, today (8th July) I have been running over in my brain how to create the entities and it's fair to say I have been fairly consumed by the whole thing. Below is a screen shot of a RAW entity detailing 3 activities. 
In a traditional database and if I was lazy, I would insert this into a table called destiny_activities, but because we are using Neo4j all that goes out the window.
If we look at theNeo4J best practices, you can see that the model is extremely normalized. Below is a screen shot of how the Neo guys would datamodel book reviews 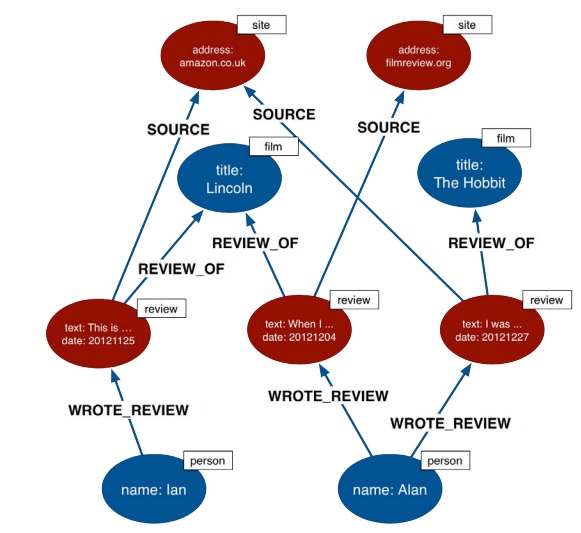
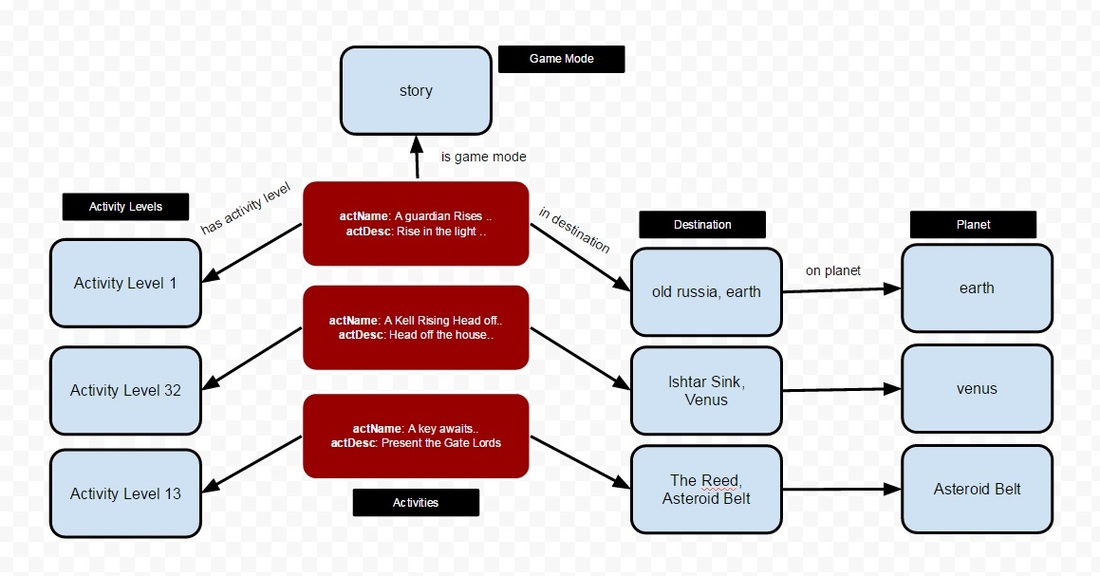
So, my preliminary data model based on the activity excel file above might look like:
This blog is a saving grace, as it forces me through an iterative design process. When you're a sole developer working on something generally we just smash code until it works and the design aspect goes some what out the window.
The next question I need to answer is how to ingest the data into Neo4J, as I create relationships to other nodes I will need to create all entity nodes first then the relationships. My thought at the moment is to create a JSON structure that looks like this: { "class": "activity", "name": "A guardian rises..", "desc": "Rise in the light", "relationships": [ { "class": "activity_levels", "name": "activity_level_1" }, { "class": "game_mode", "name": "story" }, { "class": "destination", "name": "old_russia, earth" } ] }
I would infer all of this information in a one off script I would write in Java. Once I'm done I would then write a one off script that will first run through all the entities and create them, then when that is done I would create the relationships.
I'm being a little stubborn and trying not to use theCSV importer and solely use the API's, my reason behind this is I want to get used to these interfaces as when I'm done I want this all to run automatically with no hand holding. Click here to see my next post I'm busy digging into the Neo4J implementation in Java, there seems to be two ways of writing / reading from the database: The first is pretty similar to connecting to any database, the other is using the restful API's. 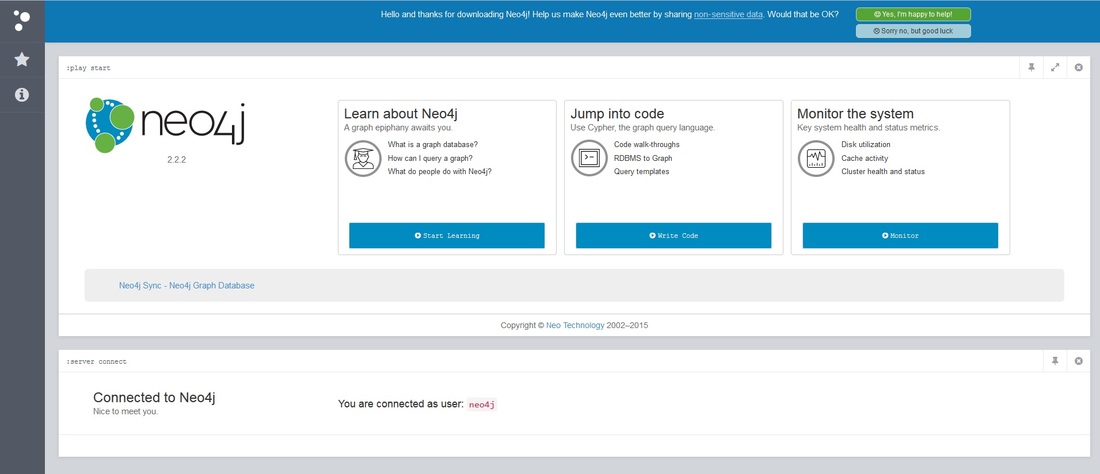 When you fire up Neo4J you do get a nice and pretty interface/console to use, one thing I have learned is that the web console utilizes the rest API's behind the scene (makes sense). I created a Neo4J DB externally on a server at home, working with DB's for so long I assumed that I could create a connection client sending along the usual "host/port/pass/user" combo. The setup is a little weird as, if you have physical separation between the application and database it somewhat forces you to use the APIs, which in the long run isn't a bad thing if you think about the way that most modern application development architecture is done these days. I'm going to have a go at writing information from the "Destiny Entities" I created in my last post through the API's. (Monday 29th June) It's been a day or so fiddling with Neo4j and I only just figured out how it all fits together, I was searching high and low with the rest API on how to make a new node with labels in one API call. I was assuming that it would have been a single object containing all the relationships and labels, I had my relational DB hat on and it took me awhile to understand how it worked (duh). This is all a discovery process for me so there are still some things I'm going to get wrong. So I understand that you create a Node, then apply labels, properties and all that good stuff in different API calls.. my brain was thinking it was all one.. when it is not! You know the old CREATE TABLE statement with PK/FK stuff all hanging off one statement, it's easy to get confused if you're old school. In saying that it would be nice if it create API call and Neo did the decoupling behind the scenes so I didn't have to make network latent rest calls for one node, label, properties creation. (Thursday / Friday 2 July) Firstly I manually loaded a couple of Destiny Entity nodes, learned a bunch made a couple of mistakes (see below) but it's still pretty cool getting visual feedback right away. 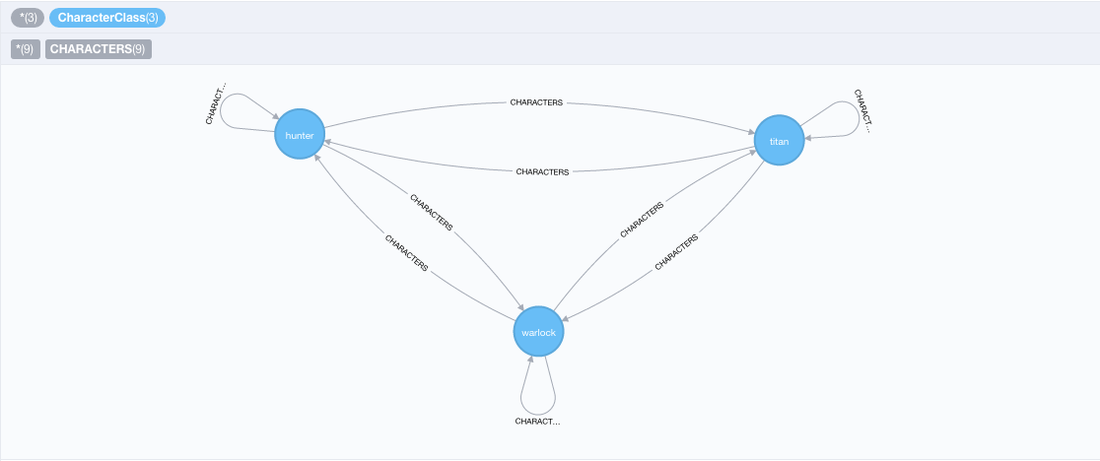 But overall things are going okey dokey! If you have read this blog series I had previously ripped destiny entity information, and before I start parsing community post information I need to get the structure and relationships between the entities correct so I can map it all out.
On Thursday I spent the time making sense of the entity data and creating the relationships & classes in Java, it probably needs another day or so before it's ready to push 4000+ of these nodes in Neo4j. By the time it's finished the output will be classes with relationship information to other classes all stored in JSON ready to consume in Neo4j. Hopefully next week I can post a visualisation of the entities all mapped out, keep posted. Check out my next post |

AuthorNew Zealand big data nerd, facial hair sculptor and classic car fanatic. Owner of needles.io, freelance big data consultant, ex Activision. Archives
April 2016
Categories
|
 RSS Feed
